Energy Requirements for Maintenance and Growth of Male Saanen Goat Kids
Article information
Abstract
The aim of study was to determine the energy requirements for maintenance and growth of forty-one Saanen, intact male kids with initial body weight (BW) of 5.12±0.19 kg. The baseline (BL) group consisted of eight kids averaging 5.46±0.18 kg BW. An intermediate group consisted of six kids, fed for ad libitum intake, that were slaughtered when they reached an average BW of 12.9±0.29 kg. The remaining kids (n = 27) were randomly allocated into nine slaughter groups (blocks) of three animals distributed among three amounts of dry matter intake (DMI; ad libitum and restricted to 70% or 40% of ad libitum intake). Animals in a group were slaughtered when the ad libitum-treatment kid in the group reached 20 kg BW. In a digestibility trial, 21 kids (same animals of the comparative slaughter) were housed in metabolic cages and used in a completely randomized design to evaluate the energetic value of the diet at different feed intake levels. The net energy for maintenance (NEm) was 417 kJ/kg0.75 of empty BW (EBW)/d, while the metabolizable energy for maintenance (MEm) was 657 kJ/kg0.75 of EBW/d. The efficiency of ME use for NE maintenance (km) was 0.64. Body fat content varied from 59.91 to 92.02 g/kg of EBW while body energy content varied from 6.37 to 7.76 MJ/kg of EBW, respectively, for 5 and 20 kg of EBW. The net energy for growth (NEg) ranged from 7.4 to 9.0 MJ/kg of empty weight gain by day at 5 and 20 kg BW, respectively. This study indicated that the energy requirements in goats were lower than previously published requirements for growing dairy goats.
INTRODUCTION
Understanding energy requirements for goats is important to the rational design of animal production systems so as to provide balanced diets that precisely meet the needs of the animals. Most studies on the nutrition of goats have been published quite recently. A still widely used publication on nutrient requirements of goats was published by the US National Research Council (NRC, 1981). Nevertheless, the diets based on the recommendations of this committee do not always accurately estimate the feed intake and performance. Causes for this low prediction might be due to these generalities have been established primarily with cattle and sheep. Several years after the publication of the NRC (1981) system, recommendations more specific for goats were developed and published for other feeding systems (AFRC, 1998; Sahlu et al., 2004; INRA, 2007; NRC, 2007).
The system of Institute for Goat Research-Langston University (IGR system) was almost integrally adopted by the recently published NRC (2007) system for goats. In this system metabolizable energy (ME) requirement were determined by regressing estimates of intake against levels of production. An attribute of this approach is relatively large numbers of observations available for use, but there are disadvantages as well (Sahlu et al., 2009). Both NRC (2007) and Sahlu et al. (2004) indicated areas in which additional research is needed to more accurately describe energy requirements of goats for improved feeding management practices. Energy requirements of NRC (2007) are for ME. To eventually advance to a net energy system, Sahlu et al. (2009) suggested that research is needed to address body composition and efficiency of ME utilization for different physiological functions.
More importantly, methodological differences could be an important source of variance of requirements estimates. Thus, for energy requirements of goats to be eventually established, a greater number of detailed studies of energy requirements and efficiencies of utilization are required. In addition, correct estimation of their energy requirements in each unique condition is necessary to optimize diet composition or to determine optimum stocking rates of goats. Therefore, this study was carried out to determine the energy requirements for maintenance and growth of Saanen goat kids using the comparative slaughter technique.
MATERIAL AND METHODS
Study location
This study was conducted at the Goat Center of Universidade Estadual Paulista (UNESP), in Jaboticabal, São Paulo, Brazil (21°14′05″ S and 48°17′09″ W). Mean minimum and maximum temperatures observed during the experimental period were 16.3°C and 30.3°C, respectively. Humane animal care and handling procedures were followed according to the university’s animal care committee.
Animals, dietary treatments and feeding plan
Intact, male Saanen kids (n = 41) with average initial body weight (BW) of 5.12±0.19 kg and an average age of 16 days were used in this study. After birth, the kids were identified and housed in individual pens (0.50 m×1.00 m) protected from rain and wind with free access to water. During the first three days, the kids received only colostrum. From the 4th to 40th day of life, cow milk was provided at a maximum quantity of 1.5 liter, twice a day, at 0700 and 1700 h. From the 41st to the 48th day of life, the kids were suckled only in the afternoon, receiving 750 mL of milk. The milk intake of animals fed ad libitum was used to determine the intake of 40% and 70% of ad libitum intake. After 7 days of age, all kids began receiving the experimental diet for ad libitum intake and they were offered enough feed to ensure that there was about 20% feed refusals each day. The experimental diet (Table 1) was formulated according to AFRC (1998) recommendations. For all calculations and measurements, the dry matter intake (DMI) from milk during the suckling period and the DMI from solid feed during throughout the experiment were considered to totalize the DMI. During the trials, animals were fed twice a day, at 0700 and 1700 h.
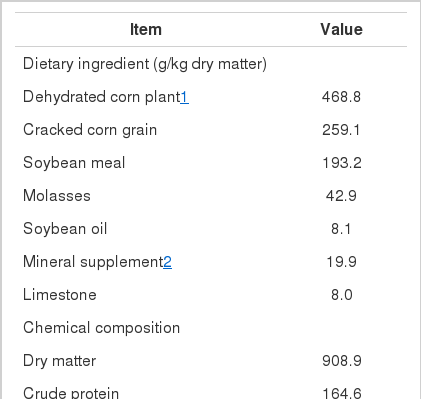
Ingredient and chemical composition of the diet
Twenty-seven kids were randomly allocated to three amounts of DMI: ad libitum and intake of 70% or 40% of ad libitum intake. Kids were pair fed in nine slaughter groups (blocks). A slaughter group consisted of one kid from each treatment and was slaughtered when the ad libitum treatment kid reached 20 kg BW. The 40% and 70% of ad libitum intake amounts were determined daily based on DMI of the kids in the ad libitum-group on the previous day. Six kids were assigned to intermediate slaughter group that were fed ad libitum and slaughtered when they reached 12.9±0.29 kg BW.
Chemical analyses
The feed ingredients were dried at 60°C to 65°C for 72 h and ground through a 1-mm screen using a Wiley mill (Arthur H. Thomas Co., Philadelphia, PA, USA). They were analyzed to determine the content of DM (AOAC, 1990; method number 930.15), fat (based on weight loss of the dry sample upon extraction with petroleum ether in a Soxhlet extraction apparatus for 6 h; AOAC, 1990, method number 930.15), crude protein (CP) (Nitrogen analysis performed via Dumas combustion using LECO FP-528LC, LECO Corp., St. Joseph, MI, USA; Etheridge et al., 1998), ash (complete combustion in a muffle e furnace at 600°C for 6 h; AOAC, 1990, method number 924.05), neutral detergent fiber with amylase and without sulfite (Van Soest et al., 1991), acid detergent fiber (Goering and Van Soest, 1970), and gross energy (GE) using a bomb calorimeter (Parr Instrument Co., Moline, IL, USA).
Sample collection and digestibility trial
A digestibility trial with a completely randomized design was conducted using 21 kids (mean BW at start: 19.4±3.9 kg; same animals of the comparative slaughter trial) at three levels of intake. This trial was conducted when the animals were only receiving solid feed. This was chosen due to carrying out a digestibility assay with very young animals is complicated because of the small amount and consistency of the feces, and the level of stress to which young animals would be subjected. Thus, the daily milk and solid diet intakes were recorded separately and analyzed (diet offered and orts) for DM, CP, and GE. A general relationship between ME and GE for milk (ME milk = 0.93×GE milk; NRC, 2001) was obtained from the literature, and using this factor the ME intake (MEI) from milk could be calculated. The MEI from solid could be calculated using the data from digestibility trial. Then the total MEI for the whole experiment was obtained as the sum of daily MEI from milk and daily MEI from solid diet.
The animals were housed in individual metabolic cages when they were at approximately 70 d of age. Their feed intake and feed refusals were recorded, and their feces and urine were collected for 7-d after a 5-d adaptation period to each amount of intake. Urine was acidified daily with 20 mL of 6 M HCl. Feeds and feed refusals were sampled daily, and the samples were stored at −20°C. Feces and urine were weighed daily, and a 10% total output was sampled and stored at −20°C. Composites of the feed, feed refusals, and feces were dried at 60°C to 65°C for 72 h and ground through a 1-mm screen using a Wiley mill. Composites of urine were passed through a sieve to remove the large particles, and a subsample was taken for N determination. The GE was determined for feeds, feed refusals, feces, and urine using a bomb calorimeter (Parr Instrument Co., USA). To measure urine energy, samples were oven dried for two days at 55°C in polyethylene capsule prior to combustion. The known heat of combustion per gram of capsule material was subtracted from the total heat observed to obtain the sample energy content. Digestible energy (DE) was computed from the GE of the feeds, feed refusals, and feces. The DE values were regressed on daily DMI (g/d) of the goats in the digestibility trial, and the regression was subsequently used in the comparative slaughter trial to estimate the DE content and intake. Dietary ME was calculated using the GE intake minus the fecal and urinary losses and losses by gaseous products of digestion (Blaxter and Clapperton, 1965), as follows in the Eq. 1:
In which ME = metabolizable energy; GEI = GE intake; GEf = GE of feces; GEu = GE of urine; and EGPD = energy of gaseous products of digestion (GPD×GEI/100); GPD = [4.28+(0.059×GE digestibility)].
Slaughtering and body composition determination
Before slaughter, shrunk body weight (SBW) was measured as the BW after 16 h without feed and water. At slaughter, kids were stunned with an electric shock and killed by exsanguinations using conventional humane procedures. Their blood was weighed and sampled. The body was separated into individual components, which were then weighed separately. The components included internal organs (liver, heart, lungs and trachea, tongue, kidneys, and spleen), emptied and cleaned digestive tract (rumen, reticulum, omasum, abomasum, and small and large intestines), hide, head, feet, and carcass. The digestive tract was weighed before and after emptying and flushing with water to determine the empty BW (EBW), which was calculated as the SBW at slaughter minus digestive tract contents.
All body components were initially frozen at −6°C and then cut into small pieces, ground with a large screw grinder through a plate with 0.32-cm holes, and mixed via 2 additional passes through the grinder. After grinding and homogenization, the samples were collected, frozen again, and freeze dried for DM determination. These samples, of approximately 30 g, were analyzed for fat, CP, and GE as described previously.
Calculation of the initial body composition and retention of nutrients
Initial empty body composition was estimated from the average composition of the initial slaughter group, called the baseline (BL) group, which was composed of eight kids averaging 5.46±0.18 kg BW and 15 d old. A regression equation was developed from BL animals to determine the initial EBW from the BW (BW; Eq. 2). The empty body fat (EBF; Eq. 3), empty body protein (EBP; Eq. 4) and empty body energy (EBE; Eq. 5) were estimated from the EBW for each animal the average body composition of BL animals.
Rates of EBW gain (EWG, kg/d) and of body fat, protein and energy gain were calculated as the difference between the initial and final weights of the respective body components, divided by number of days in the trial. The caloric values of retained fat and protein were assumed to be 39.3 and 23.6 MJ/kg (ARC, 1980), respectively.
Energy requirements for maintenance and growth
Heat production (HP, kJ/kg0.75 of EBW) was calculated as the difference between MEI (average MEI from milk during the suckling period+average MEI from solid feed; MEI, kJ/kg0.75 of EBW) and retained energy (RE) (kJ/kg0.75 of EBW). The antilog of the intercept of the linear regression between the log of HP and MEI was used to estimate the maintenance requirement for net energy (NEm; kJ/kg0.75 of EBW; Lofgreen and Garrett, 1968). The maintenance requirement for ME (MEm, kJ/kg0.75 of EBW) was computed by iteratively solving the semilog linear regression equation until HP was equal to MEI. Linear regressions of the log of HP on MEI were used to calculate the energy utilization for maintenance (km), which was computed as NEm/MEm. The slope of the regression of RE on MEI was assumed to be the partial efficiency of energy for growth (kg).
The NE requirements for growth (NEg) were calculated using only animals fed for ad libitum intake: eight kids slaughtered at 5.46±0.18 kg BW (BL), six kids slaughtered at 12.9±0.29 kg BW (intermediate slaughter), and nine kids slaughtered at 21.03±0.36 kg BW. Estimation of the composition for gain was obtained in two phases. In the first phase, logarithms of allometric equations (Eq. 6) were calculated to predict the protein, fat, or energy concentration from EBW (Table 5) (ARC, 1980):

Logarithmic allometric equations to estimate the body composition of Saanen intact, male kids (n = 23)
In which the component amount is the nutrient amount in the EBW (Table 5). In the second phase, equation (Eq. 6) was differentiated based on the EBW to compute estimates of the composition of the gain at various EBW (Eq. 7):
In which component is the amount of nutrient or energy concentration per unit of EBW gain (g/kg of gain or MJ/kg of gain) and a and b are parameters determined from a linear regression (Eq. 6). The NEg requirements of the gain in BW were obtained through the conversion of EBW into BW. The weight gain composition values were divided by the correction factor generated from the relationship between BW and EBW.
Statistical analyses
The data of maintenance requirements were analyzed as a randomized block design using a mixed model with the fixed effects of amounts of intake (df = 2), random effect of slaughter groups (df = 8) and random residual error using PROC MIXED (SAS Inst. Inc., Cary, NC, 9.0). When significant, means across amounts of intake were compared using protected fisher’s least significant difference test (i.e., the DIFF option of the LSMEANS statement). Data of requirements of growth were analyzed as a completely randomized design and linear regressions analyses using PROC REG of SAS. Residuals were plotted against the predicted values to check the model assumptions regarding the homoscedasticity, independence, and normality of the errors. A data point was deemed to be an outlier and removed from the database if the Studentized residual was outside the ±2.5 range values.
RESULTS
Performance and body composition
Intake influenced body composition (% EBW) of the animals (Table 2). The fat content (% EBW) for ad libitum feed-intake animals was greater than those of the 70% and 40% feed-intake animals. Fat deposited in the gain was lower (p<0.01) for 40% feed-intake group compared those in the ad libitum and 70% feed-intake groups. Protein and protein in gain were greater for animals in the 40% feed-intake group than those in the ad libitum and 70% feed-intake group. The water content for 70% and 40% feed-intake was greater than that of the ad libitum feed-intake group. There was no difference in the ash concentration (% EBW) between animals submitted to the different amount of feed intake (p>0.05). Animals in the ad libitum group had more energy deposited in the empty body (p<0.001) compared with those fed the 70% and 40% amounts.

Performance and body composition of intact, male Saanen kids at baseline (BL) and intermediate slaughter (IS) and subjected to three amounts of feed intake
Digestibility trial
It was observed that the MEI (MJ/d) and DMI (g/d) decreased as the feed restriction (70% and 40% feed-intake groups) increased (p<0.0001; Table 3). The values of DE and GE digestibility were greater for animals in the 40% feed-intake group than those in the ad libitum and 70% feed-intake groups which did not differ. The metabolizability and efficiency of DE used for ME of the diet showed no difference (p>0.05) among amount of feed intake.
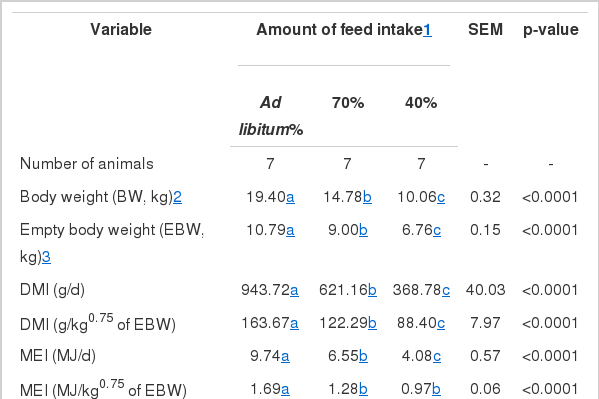
Dry matter intake (DMI), metabolizable energy intake (MEI) and energy partitioning of Saanen kids subjected to three amounts of feed intake in a digestibility trial
The resulting regression equations (Eq. 8 and 9) were used in the comparative slaughtering experiment to estimate the DE (MJ/kg of DM) and ME (MJ/kg of DM) content and then the MEI for the entire experimental period. Intake level affected total DMI and total MEI (p<0.05) and the energy balance of animals throughout the experiment (Table 4). Following the same trend seen in the digestibility trial (Table 3), reductions in the total DMI (g/d) and MEI (MJ/d) were significantly different (p<0.001) among the intake levels.
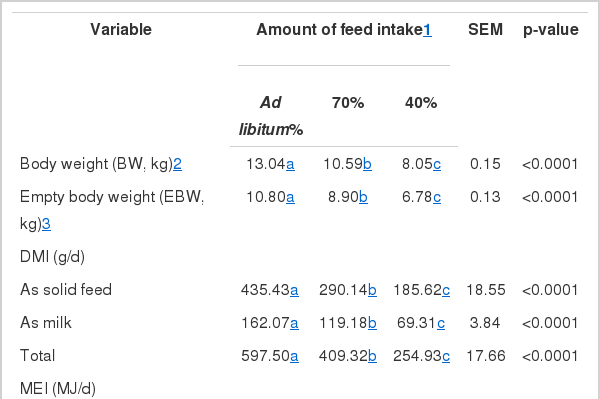
Dry matter intake (DMI), metabolizable energy intake (MEI) and energy balance of Saanen intact, male kids subjected to three amounts of feed intake throughout the experimental period
Retained energy
Animals fed for ad libitum intake had greater RE (MJ/kg0.75 of EBW) and HP (MJ/kg0.75 of EBW) than those animals in the 70% and 40% feed-intake groups (p<0.001; Table 4). The relationship between the RE in the body of animals and RE predicted by the retention of protein and fat (REp+f) (Eq. 10) showed a high degree of precision and accuracy. This means that the RE in the body of animals can safely be estimated based on the retention of protein and fat. The percentage of RE deposited as protein (% REp) decreased exponentially as the content of RE in the gain (RE, MJ/kg of EWG) increased (Figure 1; Eq. 11, the data referring only to the restriction period).

Relationship between the percentage of retained energy deposited as protein (% REp) and the content of retained energy in the empty body weight gain (RE; MJ/kg of empty weight gain, EWG): % REp = 188.50(±19.74)×exp[ 0.1506(±0.01)×RE], R2 = 0.85; p<0.001].
Energy requirement for maintenance and growth
The relationship between HP and MEI is shown in Figure 2. In the present study, the NEm was obtained through regression between the log of HP (kJ/kg0.75 of EBW) and MEI (kJ/kg0.75 of EBW) for growing Saanen goats (Eq. 12). The NEm of Saanen kids (from 5 to 20 kg BW) was 417 kJ/kg0.75 of EBW (357 kJ/kg0.75 of BW), while the MEm that was calculated by iteration assuming HP to be equal to MEI at maintenance was 657 kJ/kg0.75 of EBW (562 kJ/kg0.75 of BW). The partial efficiency of ME used for NEm (km) found in this study through the NEm/MEm ratio was 0.64.
Relationship between the logarithm of heat production (HP) and the ME intake (MEI; kJ/kg0.75 of empty BW) for Saanen intact male kids. Log10 HP = 2.62(±0.014)+0.0003±(0.00001)×MEI; R2 = 0.97, RMSE = 0.0152, p<0.0001. BW, body weight; ME, metabolizable energy; RMSE, root mean square error.
Considering the weight range of 5 to 20 kg BW, an increased of NEg from 7.38 to 9.00 MJ/kg EWG was observed (Table 6). An increase of 35% in the fat content, 18% in the energy content, and 4.5% in the protein content were observed when the BW ranged from 5 to 20 kg (Table 6). The kg value was calculated as the slope of the regression of RE (MJ/kg0.75 of EBW) on MEI (MJ/kg0.75 of EBW). The slope of the equation was different from zero (p<0.001) and indicated a kg value of 0.21. In the current study, using kg = 21%, the MEg requirements ranged from 34.10 to 36.07 MJ/kg average daily gain (ADG) for Saanen goats with BW ranging from 5 to 20 kg, respectively.
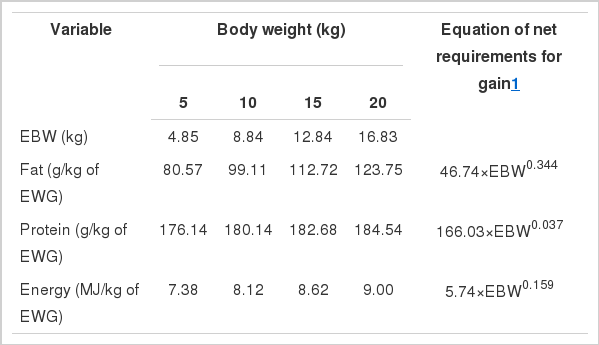
Estimates of fat, protein and energy concentrations in the equation to predict net requirements for gain of the empty body weight gain (EWG) at different body weight of Saanen intact male kids
DISCUSSION
It has been reported that, as the animal’s EBW increases and physiological maturity approaches, the deposition of muscle tissue is reduced and the deposition of fat is increased. This behavior is considered as the normal growth pattern of the animal, where fat tissue has later growth compared to the body growth (Lawrence and Fowler, 2002). The animals fed for ad libitum intake had an EBW approximately 23% higher than animals in the 70% feed-intake group. However, the body compositions were similar, indicating that changes in the proportions of tissues deposited in body also depend on the quality and utilization of feed that the animals were provided. The RE in the empty body of the animal is directly related to the amount of fat and protein deposited in the empty body (ARC, 1980). Therefore, it was expected that the amount of energy in the empty body of animals in the 70% feed-intake group would be similar to that of animals fed for ad libitum intake. However, due to the factors besides EBW and age, the animals that fed ad libitum had more energy deposited in the empty body. It is possible that animals in the 70% feed-intake group used more energy for the deposition of protein, since this variable did not differ between these animals and those fed ad libitum. A decrease in the water content of the body of animals was associated with an increase in the fat proportion, confirming an inverse relationship between these two body constituents. A non-significant difference in the ash concentration (% of EBW) between animals submitted to the different feed intake levels may be attributable to the fact that the ash and protein concentration changes a little with weight and/or age as related by Bezabih and Pfeffer (2003).
In general, the loss of energy through feces increased and DE decreased as feed intake increases due to the decrease in retention time of the digesta in the rumen and factors influencing the motility of the gastrointestinal tract (NRC, 2007). The efficiency of DE used for ME of the diet showed no difference among feed intake levels. However, this efficiency average was higher than that recommended by the NRC (1989), which considers a constant value of 82.0%. Using fixed values may under or overestimate the ME of the diet, depending on the intake level and amount of fiber in the diet.
The RE and HP values were higher in animals fed ad libitum than those in the 70% and 40% feed-intake group. Indicating that HP increased with increasing MEI and that the quality and quantity of feed can change the HP and MEm requirements (Tolkamp, 2010). Goats are able to survive under severe feed restriction because their ability to minimize HP or energy expenditure when on a low nutritional plane such as near maintenance and fasting. It has been suggested that goats may be more capable of decreasing energy expenditure in such conditions compared with other ruminant species (Silanikove, 2000).
The REp decreased exponentially as content of RE in the gain increased. This behavior was expected because the proportion of muscle and fat changes during the growth and development of the animal. Thus, the deposition of muscle tissue is greater at the beginning of the growth phase and decreases when the proportion of fat deposition increases (Colomer-Rocher et al., 1992). This agrees with the results reported in goats (Fernandes et al., 2007) and in cattle (Tedeschi et al., 2004; Chizzoti et al., 2007). This finding suggests that REp can be used to compute the partial efficiency of ME to NE for growth.
MEm estimates (562 kJ/kg0.75 of BW) were lower than the average value of 580 kJ/kg0.75 of full BW for growing dairy goats and 624 kJ/kg0.75 of full BW for intact male goats reported by Sahlu et al. (2004) and Luo et al. (2004e), respectively, which served as the basis for publication of the NRC (2007). These differences might be partially attributable to experimental conditions. In the present study, the goats were housed in relatively small areas, such as metabolism chambers or crates, whereas goats in most of the publications from other studies were kept under more normal farm or production conditions, hence their greater activity. Another factor to consider in explaining lower MEm estimates is that the kids were fed a combination diet (milk plus dry feed during the suckling period). According to NRC (1989), efficiencies of utilization of ME for maintenance and gain will be somewhat higher for milk than starter feeds; nevertheless, there are few data available on subject.
Our energy requirement estimates were different from recommendations from the older feeding system for goats (NRC, 1981; AFRC, 1998). The NRC (1981) recommends average values of 239 and 424 kJ/kg0.75 of BW for NEm and MEm, respectively. On the other hand, the AFRC (1998) suggests an average of 315 and 438 kJ/kg0.75 of BW for NEm and MEm, respectively. Possible factors responsible for this difference can be attributed to the different methods used to obtain maintenance energy, different breeds, experimental conditions and even the use of data from different species (cattle and sheep). In a study conducted by Fernandes et al. (2007) values of 323 and 494 kJ/kg0.75 of EBW for NEm and MEm, respectively were observed in studies with intact 3/4 Boer×1/4 Saanen goats (from 20 to 35 kg BW). Much of the variation found may be explained by differences in weight, maturity stage, and breed. Dairy animals have lower amounts of body fat and, therefore, different nutritional requirements.
Generally, the km value is calculated by the ARC (1980) from equation km = 0.35×qm+0.503, where qm = metabolizability. Using this equation and the mean value of qm measured in the present study (61%), the value of km would be 71.6%, which is approximately 12% greater than our km, which was 64%. Using the km obtained by ARC (1980) and the value of 417 kJ/kg0.75 of EBW as NEm, the MEm would be 582 kJ/kg0.75 of EBW, or approximately 12% less than the value found in this study (657 kJ/kg0.75 of EBW). Therefore, acceptance of km estimated by the ARC system would result in the underestimation of MEm requirements. This underestimate has also been observed by other researchers with growing goats (Fernandes et al., 2007) and lambs (Galvani et al., 2008). The km found in this research is similar to the value suggested by the Cornell Net Carbohydrate and Protein System (CNCPS) for sheep (Cannas et al., 2004), as well as to that used by the Small Ruminant Nutrition System (SRNS) (Tedeschi et al., 2010) which assumed to be constant and equal to 64.4%.
The NEg ranged from 7.38 to 9.00 MJ/kg EWG, considering the weight range of 5 to 20 kg BW. This increase in the NEg may be attributable to the progressive increase in fat deposition with the increase in BW. For 3/4 Boer×1/4 Saanen animals with weights ranging from 20 to 35 kg of BW, Fernandes et al. (2007) observed values of 10.46 to 12.55 MJ/kg EWG. The NRC (1981) suggested 16.73 MJ/kg EWG for goats, regardless of BW. The requirements for goats of NRC (2007) were determined based on BW gain and did not consider the composition of tissue gain because insufficient data available in the literature. The animals studied by Fernandes et al. (2007) showed higher NEg than animals in the current study. These differences in the NEg requirements were probably due to the higher concentrations of fat in gain, and consequently, a higher concentration of energy in relation to protein and higher concentration of water in lean tissue than in adipose tissue (Luo et al., 2004e), due to the fact that animals were heavier and older.
In an attempt to isolate the influence of the difference in size between the digestive tracts of animals from different weights, a correction factor for each weight was used (BW/EBW), being 1.03, 1.13, 1.17, and 1.19, respectively for 5, 10, 15, and 20 kg BW. For animals with ADG of 100 g, the NEg ranged from 0.71 to 0.76 MJ/d when the BW changed from 5 to 20 kg, while Fernandes et al. (2007) reported higher NEg values (0.91 to 1.08 MJ/d). The AFRC (1998) recommended values from 0.66 to 1.15 MJ/d for animals with weights ranging from 5 to 20 kg of BW, respectively. These differences may be due to the changes that occurred in the composition of body gain, among other factors, as previously mentioned. In addition, another explanation is that the AFRC (1998) equations are not suited for all breeds, since they consider an absolute BW value, regardless the degree of maturity of the animals. Recommendations for energy requirements of goats from NRC (2007) are based primarily on reports summarized by Sahlu et al. (2004) which did not consider the composition of tissue gain and the estimates were determined based on dietary requirement that is MEg.
In the current study, the slope of the regression of RE on MEI was assumed to be the kg which indicated a value of 0.21. This value is different to the value (0.48) estimated using the AFRC (1993) equation (kg = 0.006+0.78×qm) and to the value (0.38) estimated considering the equation cited by Tedeschi et al. (2010) (kg = 18.36/[27+41×REp]). According to these authors, the use of the combination of body composition and energy content of the diet might be a better approach in computing the km and kg. Therefore, there is a need for new research into the energy requirements of goats, as well as to develop mathematical models that more efficiently represent the biological behavior of nutrient deposition.
CONCLUSION
In conclusion, our study indicated that NEm was 417 kJ/kg0.75 of EBW, while the MEm was 657 kJ/kg0.75 of EBW. The male Saanen goats have a requirement of NEg ranging from 7.38 to 9.0 MJ/kg of EWG. The current study demonstrates that growing Saanen kids have nutritional requirements for energy lower than those that have been reported by most international feeding systems. Additional research is needed for other classes of goats fed under different ratios of concentrate to forage, and different management conditions and with a wider range of goat BW.
ACKNOWLEDGMENTS
We thank the Coordenação de Aperfeiçoamento de Pessoal de Nível Superior (CAPES, Brasília, DF, Brazil) and Fundação de Amparo a Pesquisa do Estado de São Paulo (FAPESP, Brazil, Proc. 04/05833-1) for providing financial support.