Genetic Structure of and Evidence for Admixture between Western and Korean Native Pig Breeds Revealed by Single Nucleotide Polymorphisms
Article information
Abstract
Comprehensive information on genetic diversity and introgression is desirable for the design of rational breed improvement and conservation programs. Despite the concerns regarding the genetic introgression of Western pig breeds into the gene pool of the Korean native pig (KNP), the level of this admixture has not yet been quantified. In the present study, we genotyped 93 animals, representing four Western pig breeds and KNP, using the porcine SNP 60K BeadChip to assess their genetic diversity and to estimate the level of admixture among the breeds. Expected heterozygosity was the lowest in Berkshire (0.31) and highest in Landrace (0.42). Population differentiation (FST) estimates were significantly different (p<0.000), accounting for 27% of the variability among the breeds. The evidence of inbreeding observed in KNP (0.029) and Yorkshire (0.031) may result in deficient heterozygosity. Principal components one (PC1) and two (PC2) explained approximately 35.06% and 25.20% of the variation, respectively, and placed KNP somewhat proximal to the Western pig breeds (Berkshire and Landrace). When K = 2, KNP shared a substantial proportion of ancestry with Western breeds. Similarly, when K = 3, over 86% of the KNP individuals were in the same cluster with Berkshire and Landrace. The linkage disquilbrium (LD) values at r2 0.3, the physical distance at which LD decays below a threshold of 0.3, ranged from 72.40 kb in Landrace to 85.86 kb in Yorkshire. Based on our structure analysis, a substantial level of admixture between Western and Korean native pig breeds was observed.
INTRODUCTION
Evidence supports the independent domestication of pigs in Asia and Europe from wild boar subspecies (Giuffra et al., 2000; Kijas and Andersson, 2001; Larson et al., 2005). The majority of the world’s pig genetic resources comprise indigenous types. Native or local pig breeds harbor unique genetic variants that may provide future breeds with the flexibility to change in response to product market preferences, production environments, and breeding goals. Despite the key role played by indigenous breeds in marginal environments, pig improvement and development programs have focused on several intensively selected Western (European) pig breeds, leaving locally adapted indigenous breeds unsuitable for intensive commercial breeding due mainly to their slow growth rates, light carcass weights, low feed conversion efficiencies, and low lean meat production levels (Yang et al., 2003). As a consequence of indiscriminate crossbreeding and breed substitution, over 18% of the world’s pig breeds are experiencing genetic erosion (Nidup and Moran, 2001; Food and Agriculture Organization of the United Nations (FAO, 2007), while the status of the vast majority of breeds remains unknown. For example, many commercial breeds introduced into China have been shown to contribute to the genetic pools of most indigenous breeds (Yang et al., 2003).
Similarly, for the last two decades, Western pig breeds have been imported into the Korean peninsula and crossed with the Korean native pig (KNP) to improve its growth and carcass-related traits, which has led to a dramatic drop in the KNP population (Yeo et al., 2000; Kim et al., 2005). Small effective population sizes can result in the loss of genetic diversity, which can in turn lead to reduced individual fitness and response to selection (Ficetola et al., 2007). Although commercial pig breeds are superior in terms of growth and feed efficiency traits, the KNP is known for its better meat quality (high redness and intramuscular fat), and greater ability to thrive under low-management conditions (Yeo et al., 2000; Park et al., 2007; Kim et al., 2011). Despite the concerns regarding the loss of genetic diversity from and introgression of Western pig breeds into the KNP, the level of admixture at the whole-genome level remains unclear.
Comprehensive information on genetic diversity and introgression is desirable for the design of rational breed improvement and conservation programs. Several previous studies have examined the genetic diversity of KNP. However, these studies have focused exclusively on limited numbers of microsatellite markers (Kim and Choi, 2002; Kim et al., 2005) and mtDNA (Kim et al., 2002a). Over the past several years, through the advancement of high-throughput sequencing technology, thousands of single nucleotide polymorphisms (SNPs) have been discovered, creating unprecedented opportunities for genome-wide genetic diversity analysis, genetic mapping, genome-wide association studies, and marker-assisted selection (Duran et al., 2009). SNPs embody the main source of genetic variation, have low mutation rates, and are associated with complex heritable traits (Suh and Vijg, 2005).
As in cattle and sheep, thousands of SNPs have been identified in pigs using next-generation sequencing technology (Ramos et al., 2009). The Illumina Porcine SNP60K BeadChip allows for more precise and comprehensive genome-wide investigations of genetic diversity and admixture levels among pig breeds than could be performed using smaller and lower-density microsatellite markers. The chip can also be used to estimate the level of linkage disequilibrium (LD) at the genome level. This ability will further help to refine previous investigations conducted using molecular markers of limited number and density. To the best of our knowledge, this study is the first to employ SNPs to investigate the genetic diversity of and quantify the level of European introgression into KNP. In this study, we genotyped 93 animals, representing four Western pig breeds and a KNP population, using the high-density Porcine 60K SNP BeadChip to explore the genetic diversity within and between breeds and to estimate the level of admixture between Western and Korean native pig breeds.
MATERIALS AND METHODS
Breeds, sampling, and genotyping
Samples were collected from a total of 93 animals, representing four Western pig breeds, Berkshire (BK, n = 30), Duroc (DU, n = 24), Landrace (LR, n = 6), and Yorkshire (YK, n = 17), and KNP (n = 16). All DNA samples were obtained from the National Institute of Animal Science (NIAS) in Korea and commercially genotyped using the Porcine SNP 60 BeadChip according to the Illumina protocols (http://www.illumina.com). Common monomorphic SNPs for all of the breeds were discarded from further analyses. Autosomal SNPs were filtered with the criteria of call rate (≥90%), minor allele frequency (≥5%), and Hardy Weinberg equilibrium (≥0.001). A final total of approximately 31,755 SNPs was considered for the study.
Analyses of molecular variance
Analyses of molecular variance (AMOVA) were conducted using the program Arlequin (Excoffier et al., 2005) to determine the genetic variance within and among breeds. To assess genetic diversity, observed heterozygosity (HO) and expected heterozygosity (HE) were calculated within each breed. Fixation indices were estimated according to Weir and Cockerham (1984) using the same package. The significance of the fixation indices was determined using permutation tests (1,000 permutations). The significance of the pairwise population differentiation values was similarly determined by permutation testing (1,000 permutations). Reynolds genetic distance (Reynolds et al., 1983) was calculated using PowerMarker (Liu and Muse, 2005).
Population admixture
For the analysis of population structure, a Bayesian model-based analysis was performed using structure 2.3.4 (Pritchard et al., 2000). This software assumes a model in which there are K populations (clusters) that contribute to the genotype of each individual and are characterized by a set of allele frequencies at each marker locus. The method attempts to assign individuals to populations based on their genotypes while simultaneously estimating progenitor population allele frequencies. A Monte Carlo Markov chain method was used to estimate the allele frequencies in each of the K populations and the degree of admixture for each individual animal. The number of clusters was inferred using five independent runs with 100,000 iterations and a burn-in period of 20,000 iterations, following the admixture ancestry model and the correlated allele frequencies for K values ranging from 2 to 5. The pattern of breed admixture was further analyzed through principal component analysis (PCA) using the SNP and variation suite version 7 (Golden Helix, Inc., Bozeman, MT, USA www.goldenhelix.com). The PCA was conducted to determine the breed relationships based directly on allele frequencies using a multivariate method, which condenses the information from a large number of alleles and loci into a few synthetic variables.
Linkage disequilibrium analysis
Among the several measures of LD, r2 and |D′| are usually used to estimate the extent of LD (Hill, 1981). The LD estimation using |D′| is particularly useful for determining LD at longer distances and is known to be robust for smaller sample sizes (Chen et al., 2006; Khatkar et al., 2008). We estimated linkage disequilibrium using both |D′| and r2 between adjacent SNPs with the SNP and variation suite version 7 (Golden Helix, Inc., USA).
RESULTS
Within-breed genetic diversity
Genetic variability parameters are presented in Table 1 for the four Western pig breeds and the KNP population. The average HO ranged from 0.32±0.17 in BK and KNP to 0.42±0.22 in LR. The HE was the lowest in BK (0.31±0.15) and highest in LR (0.39±0.13). The average within-breed inbreeding was found to be −0.003 and was not significantly different from zero (p>0.05). Deficient heterozygosity was observed in both KNP and LR, resulting in inbreeding coefficients of 0.029 and 0.031, respectively. Significant deviation (p<0.05) from the Hardy-Weinberg equilibrium was detected in YK (3.6%) and KNP (2.37%) for the total number of SNPs (31,755).
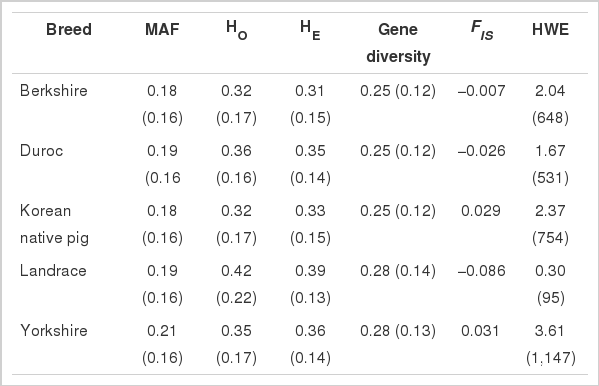
Indicators of genetic diversity and their standard deviations in Korean native pig and Western pig breeds
Genetic distances, differentiation, and admixture
The levels of breed differentiation can be quantified using fixation indices. Population differentiation (FST) estimates were significantly different (p<0.00001) from zero, with an overall value of 0.27. Reynolds and FST values among the five pig breeds are given in Table 2. The average FST and Reynolds genetic distances between the Western pig breeds and KNP were 0.27 and 0.31, respectively. Divergence (FST) was the lowest between LR and YK (0.20), while the largest divergence (0.30) was detected between KNP and DU. Similarly, the lowest (0.25) and highest (0.36) Reynolds genetic distances were observed between KNP and DU animals. To quantify the levels of within- and between-population variation, we conducted AMOVAs, and the results revealed that approximately 73% of the total variation consisted of within-breed variation and the remaining 27% of between-breed variation.
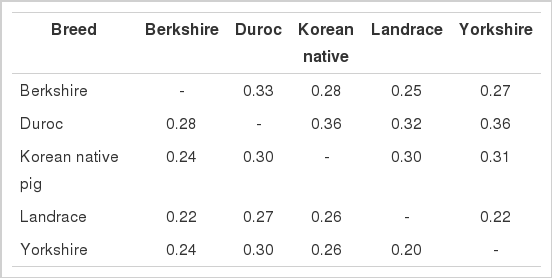
Reynolds (above diagonal) genetic distances and genetic differentiation (FST) (below diagonal) among the pig breeds
The patterns of population structure were investigated using Structure and PCA. As shown in Figure 1, principal components one (PC1) and principal components two (PC2) explained approximately 35.06% (Eigenvalue = 7.89) and 25.20% (Eigenvalue = 5.67) of the total variation, respectively. The results indicate clear separations of DU and YK from the remaining breeds by PC1 and PC2, respectively. Excepting 13% of the sampled individual animals, DU pigs were separately clustered from the remaining breeds. The Bayesian approach of Structure analysis for inferred populations with K values from 2 to 5 is shown in Figure 2. When K = 2, with the exception of the DU animals, all of the breeds shared a common cluster (91%). Only 13.20% of KNP and 18.6% of LR individuals shared common ancestry with DU. Surprisingly, when K = 3, over 86% of KNP individuals were in a common cluster with YK and LR, while LR was the most admixed breed, with 60%, 24%, and 16% of its individuals in clusters with YK, BK, and DU, respectively. When four clusters were inferred, the majority (91%) of the breeds were assigned into separate groups, with the exception of LR, which showed consistent admixture with YK (43%) and BK (25%). When K = 4 or 5, approximately 91% of the KNP individuals were clustered into a separate group (Table 3).

Breed clustering based on principal component analysis. PC1, principal components one; PC2, principal components two; PC3, principal components three.
Summary of estimate plots of Q for K = 5 in the five pig breeds. Each individual is represented by a single column divided into K colored segments, where K is the number of clusters assumed, with lengths proportional to each of the K inferred clusters. Black lines separate the populations indicated below the figure.
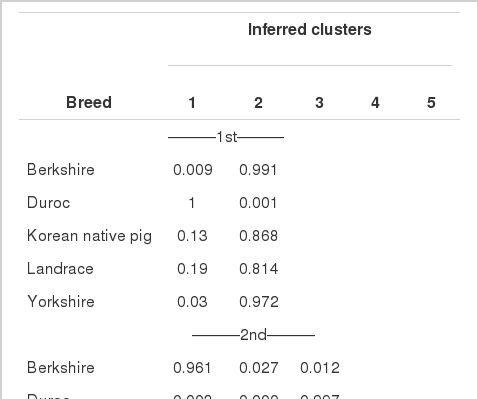
Proportions of membership of each predefined population at each of the K values, ranging from 2 to 5 clusters
Linkage disequilibrium analysis
The LD between adjacent SNP pairs was estimated using both |D′| and r2 for overall autosomes. The mean value of r2 varied between 0.25 to 0.27, while the mean value for |D′| ranged from 0.48±0.49 in LR to 0.59±0.46 in BK and YK (Table 4). An inverse relationship was observed between the LD estimates and distances between adjacent SNPs (Table 5). For example, the averge r2 and |D′| values at 20 to 40 kb were 0.26 and 0.72, respectively, while at 500 to 1 Mb, they dropped to 0.10 and 0.53, respectively. Compare to that of |D′|, the decline of r2 with increasing distance between adjacent SNPs was much steeper. The LD values at r2 0.3, the physical distance at which LD decays below a threshold of 0.3, ranged from 72.40 kb in LR to 85.86 kb in YK. The average LD extended to moderate levels (r2 = 0.21) up to 60 to 100 kb.
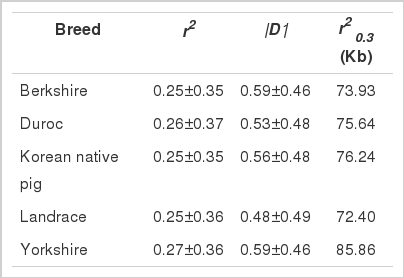
Average LD estimates in the five pig breeds between adjacent SNPs pairs

Mean LD between adjacent SNPs over different map distances
DISCUSSION
In this study, we estimated the genetic variability, structure, and admixture in four Western pig breeds and one KNP population. Observed heterozygosity was highest in LR (0.42) and lowest in KNP and BK (0.32). In comparison, lower expected heterozygosity values of 0.26 and 0.27 have been reported for Chinese Jinhua and Ganxi pig breeds, respectively, from SNP data (Ai et al., 2013). However, higher HE (0.40) was observed in the Chinese Kele pig in the same study. With exception of BK, KNP displayed a slightly lower level of heterozygosity than did the Western pig breeds, which was in agreement with the previous microsatellite- based studies (Kim and Choi, 2002; Kim et al., 2005), while FIS was negative in the Western breeds, implying that they are outbred. The observed heterozygosity deficiency in KNP may be attributed to inbreeding (FIS = 0.029). The within-breed genetic variability observed in this study was lower than that obtained in the microsatellite-based experiments (Kim et al., 2005; Nidup and Moran, 2001). These authors found expected heterozygosity values of 0.494, 0.566, 0.599, 0.702, and 0.637 for KNP, BK, DU, LR, and YK, respectively, using microsatellite analysis. Yang et al. (2003) found expected heterozygosity values of 0.70 and 0.87 in Mashen and Guanling Chinese pig breeds, respectively, by analyzing 26 microsatellites. The differences in the results obtained using SNP and microsatellite markers may reflect the multiallelic nature of microsatellite markers.
Both FST and Reynolds genetic distances revealed significant genetic differences among the pig breeds investigated. The lowest genetic differentiation (0.20) and Reynolds distances (0.22) were observed between two Western pig breeds (YK and LR). An average FST value of 0.26, which is in line with our results, has been reported between Asian and European pig breeds (Kim et al., 2005), but this is lower than the value (0.45) previously found between Chinese and Western pig breeds (Ai et al., 2013). A lower genetic differentiation (0.21) than that of the present results has previously been observed among Western pig breeds (Nidup and Moran, 2011). The inbreeding coefficient of 0.029 detected for KNP in this study was higher than that previously reported for the same population (−0.007) from an analysis of 16 microsatellite markers (Kim et al., 2005). A high level of inbreeding (FIS) was also detected in this previous study (Kim et al., 2005). This result may be due to small population size and the mating of related individuals.
The separation of DU from the remaining breeds at assumed K values from 2 to 5 was supported by PCA. The close genetic relationship and admixture displayed between LR and YK was also captured by both PCA and Structure results. The estimation of LD can be used to map quantitative trait loci, and a decrease in LD as the distance between SNPs increased has been noted in previous studies of Western pig breeds (Nsengimana et al., 2004). The r2 0.3 was lowest in LR and highest in YK. This value was lower than that previously reported for Western pig breeds (125 kb) but higher than those reported for Chinese pig breeds (10.5 kb) and wild boars (38 kb) (Ai et al., 2013). In humans, LD extends up to 50 kb (Abecasis et al., 2001). The lower LD at the thereshold of r2 = 0.3 observed in this study may be related to reduced effective population size, as most commericial breeds have undergone long periods of intesive selection. Similarly, the effective population size of KNP may be reduced because of the small number of animals used as foundation stock. The differences between the previous results and those of the present study may be justified by differences in sample size, marker density, or population demography.
Based on our Structure anaysis, we conclude that there is a substantial introgression of Western pig breeds into the KNP genome. Considering its better meat quality and adaptabilty to low-management conditions (Park et al., 2007; Kim et al., 2011), KNP should be conserved and improved for sustainable utilization. The higher inbreeding value observed in KNP could potentially reduce its genetic variabilty; therefore, a proper breeding strategy must be applied to minimize the mating of related individuals. The low LD detected in our analysis highlights the necessity of high-density markers for quantitative trait loci (QTL) mapping and marker-assisted selection. In this study, a moderate LD (r2 = 0.2) was detected, extending only to 20 to 40 kb. To confirm the results reported here, further investigation of the magnitude of LD in large samples using high-density SNP markers is required, which will bolster furture QTL mapping and marker-assisted selection.
ACKNOWLEDGMENTS
This work was supported by a grant entitled “Development of Genetic Improvement Systems in Pigs Using Genomic and Reproductive Technologies” from the Korea Institute of Planning and Evaluation for Technology of Food, Agriculture, Forestry and Fisheries and by a 2-7-10 Agenda Research (PJ00670701) grant from the National Institute of Animal Science.