Effects of Dietary Alpha-lipoic Acid and Acetyl-L-carnitine on Growth Performance and Meat Quality in Arbor Acres Broilers
Article information
Abstract
An experiment was conducted to evaluate the effects of dietary alpha-lipoic acid (LA) and acetyl-L-carnitine (ALC) on growth performance, carcass characteristics and meat quality in Arbor Acres broilers. A total of 486 1-d-old male Arbor Acres broilers were randomly allocated to 9 dietary treatments, 9 treatments were group A (0 mg/kg LA and 0 mg/kg ALC), group B (50 mg/kg LA and 0 mg/kg ALC), group C (100 mg/kg LA and 0 mg/kg ALC), group D (0 mg/kg LA and 50 mg/kg ALC), group E (50 mg/kg LA and 50 mg/kg ALC), group F (100 mg/kg LA and 50 mg/kg ALC), group G (0 mg/kg LA and 100 mg/kg ALC), group H (50 mg/kg LA and 100 mg/kg ALC), group I (100 mg/kg LA and 100 mg/kg ALC). Birds were slaughtered at 42 days old. Average daily gain (ADG), average feed intake (AFI), feed conversion rate (FCR), eviscerated rate, breast muscle percentage, thigh muscle percentage, abdominal fat percentage, liver weight, muscle color (L* value, a* value, b* value), pH values at 45 min and 24 h postmortem were measured. Results showed that there existed an interaction between LA and ALC in growth performance of broilers, carcass traits and meat quality. The overall result is that high level of LA and ALC led to lower AFI, ADG (p<0.01), lower abdominal fat percentage, liver weight (p<0.01), lower L* value, a* value, and b* value of breast muscle, L* value of thigh muscle (p<0.05), and higher FCR (p<0.01), eviscerated rate (p<0.01), breast muscle percentage, thigh muscle percentage (p<0.05), a* value, pH 45 min and pH 24 h of thigh muscle (p<0.01). These results suggested that dietary LA and ALC contributed to the improvement of meat quality in broilers.
INTRODUCTION
Alpha-lipoic acid (LA) and its reduced form, dihydrolipoic acid (DHLA), have received widespread attention as antioxidants with both preventative and therapeutic uses in humans and laboratory animals. The reduced form of LA, is a powerful mitochondrial antioxidant (Moini et al., 2002). Dietary administration of LA elicits fatty acid mobilization in β-adrenergic response to isoproterenol when the basal level of plasma glucose is maintained (Hamano et al., 2000). LA is a mitochondrial nutrient and it is also one of the mostly studied mitochondrial nutrients on mitochondrial function in cellular and animal models related to brain aging and neurodegeneration (Liu, 2008). LA decreased the adenosine 5′-monophosphate (AMP)-activated protein kinase (AMPK) activity in the hypothalamus and caused profound weight loss in rats by decreasing food intake and enhancing energy expenditure (Kim et al., 2004). Shen and Du has reported that dietary LA supplementation is a potential way to reduce the incidence of pale, soft, exudative (PSE) meat (Shen and Du, 2005).
Acetyl-L-carnitine (ALC) is an acetylated form of L-carnitine which is derived from lysine and methionine. The major metabolic role of L-carnitine appears to be the transport of long-chain fatty acids into the mitochondria for β-oxidation (Coulter, 1995). ALC treatment was also found to restore mitochondrial function and ambulatory activity (Hagen et al., 1998).
Our laboratory’s previous study showed that LA concentrations can enhance anti-oxidative ability of broilers; however at the expense of growth performance (Zhang et al., 2009), due to the fact that LA can reduce food intake and body weight, especially at high supplementation amounts (Kim et al., 2004). Zhang found that ALC contributes to ameliorate meat quality and to improve lipid metabolism in broilers (Zhang et al., 2010). Whether there exists an interaction between LA and ALC in the growth performance and meat quality is not known. Furthermore, whether or not similar responses to dietary LA and ALC could be observed in broilers has not been confirmed.
This study aimed to evaluate the effects of dietary LA and ALC on growth performance, carcass traits and meat quality in broilers and to search for the interaction between dietary LA and ALC.
MATERIALS AND METHODS
Birds and diets
A total of 486 1-d-old male Arbor Acres broilers were selected to evaluate the effects of dietary LA+ALC on growth performance, carcass characteristics and meat quality. The birds were randomly allocated to 9 dietary treatments with 6 replicates of 9 birds per replicate pen, which was equipped with raised-wire floor. Birds were vaccinated for Newcastle disease and infectious bronchitis disease at hatchery, on 7 and 21 d of age, respectively. A 24 h lighting regime was carried out during the first 3 days, and 23 h lighting with 1 h darkness from 4 d of age was used. Mean air temperature of the animal chamber was maintained at approximately 35°C during the first week, then decreased gradually to get a constant temperature of 25°C during the rest of the trial. All birds had access to feed and water ad libitum, the whole experiment period lasted 42 days.
In the present study, nutrient contents met or exceeded the NRC (1994) recommendations. The diet supplemented with LA and ALC, and a 3×3 factorial treatment arrangement was employed. The composition and nutrient content of basal diet formulated for broilers in different growing phases are shown in Table 1.
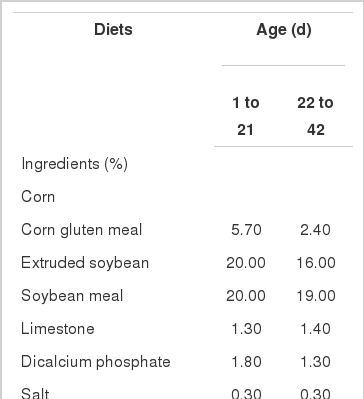
Composition and nutrient content of basal diets in different growing phases
Sample collection
On 42 d of age of the experiment, two birds from each pen with body weights close to the average were selected. Feed and water were withdrawn 12 h prior to slaughter. The birds were humanely slaughtered and carcasses were collected. Breast and thigh muscle from both sides of the carcass were skinned and deboned for the measurements of carcass traits, muscle color (L* value, a* value, b* value), muscle at 45 min, 24 h after slaughter.
Measurements
Carcass characteristics
Live body weight, carcass weight, and weight of breast and thigh muscle from both sides of the carcass were weighed. Carcass weight was defined as the weight of the feather-scalded, eviscerated carcass (with head, neck, blood, and hocks removed) (Dilger et al., 2006). After measuring the carcass weight, breast and thigh muscle from both sides were skinned and deboned for the measurements of carcass traits, pH value and muscle color.
Muscle color
Hunter L* (lightness), a* (redness), and b* (yellowness) values were generated from breast and thigh muscle at the time of deboning, using a hand-held color difference meter (SC-80C, Kangguang apparatus Co. LTD., Beijing, China), with an illuminant D65 and 10° standard observer. An average of three reading values from the medial surface of the muscle free from color defects, bruising and hemorrhages were taken for color evaluation (Fletcher, 1999).
Muscle pH
Muscle pH was measured at 45 min and 24 h after slaughter by using a testo 205 pH meter (Testo Instrument Co. Ltd., Germany). The pH meter was standardized by using a two-point method against standard buffers of pH 4.0 and pH 7.0. Three measurements were recorded and averaged for each breast and thigh muscle.
Statistical analysis
Data was conducted using a randomized complete block design. The statistical analyses were performed using the General Linear analysis of variance procedure of Statistical Analysis System (SAS 8.0). Significant effects were further explored using Duncan’s multiple (GLM procedure) comparisons to ascertain differences among treatment means. A significance level of p<0.05 was used during analysis and other significance levels were also specified whenever necessary.
RESULTS
Table 2 describes the effects of dietary LA and ALC on the growth performance. Addition of LA to broiler’s feed had a significant impact on average daily feed intake average feed intake (AFI) and average daily gain (ADG). Broilers fed 50 mg/kg or 100 mg/kg LA had lower AFI (p<0.01) than that of no LA treatment, and broilers fed 100 mg/kg LA had lower ADG than other treatments. There was no significant difference of FCR among treatments. Addition of ALC to broiler’s feed had significant impact on ADG, AFI and FCR. Broilers fed 100 mg/kg ALC had lower average feed intake (p<0.01) than other treatments, fed 50 mg/kg or 100 mg/kg had lower ADG (p<0.01) than no ALC treatment, and fed 100 mg/kg ALC had higher FCR (p<0.05) than that of 50 mg/kg ALC treatment. There existed an interaction between LA and ALC in growth performance of broilers. The overall trend is that high level of LA and ALC resulted in lower average feed intake and ADG (p<0.01), and higher FCR (p<0.01).
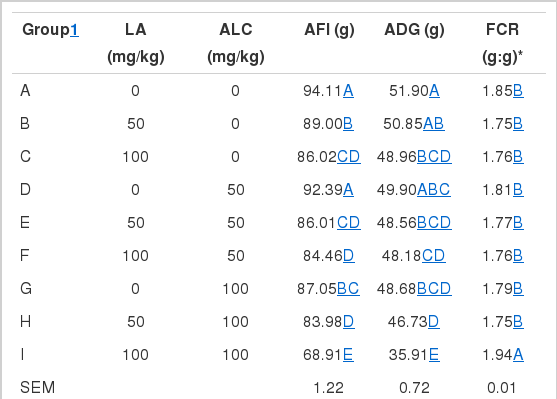
Effects of dietary LA and ALC on the growth performance of broilers
The effects of dietary LA and ALC on carcass traits are presented in Table 3. Dietary LA had significant effects on eviscerated rate and liver weight (p<0.01). Addition of ALC to broiler’s feed had a significant impact on eviscerated rate (p<0.01), breast muscle (p<0.05), abdominal fat percentage (p<0.05) and liver weight (p<0.01). There existed an interaction between LA and ALC in carcass characteristics of broilers. The overall trend was that high level of LA and ALC resulted in higher eviscerated rate (p<0.01), breast muscle percentage and thigh muscle percentage (p<0.05), and lower abdominal fat percentage and liver weight (p<0.01).

Effects of dietary LA and ALC on carcass characteristics of broilers
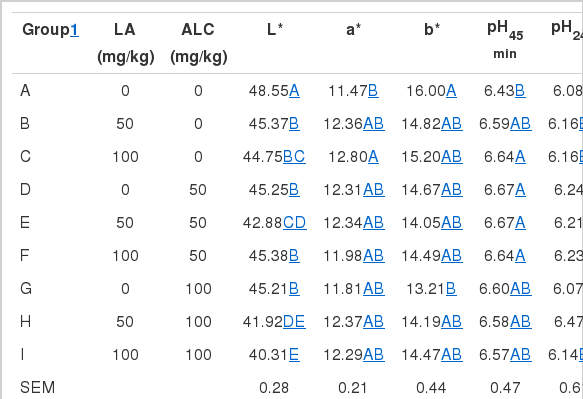
Table 4 shows the effects of dietary LA and ALC on pH value, muscle color (L* value, a* value, b* value) of breast muscle. Addition of LA to broiler’s feed had significant impact on L* value and pH24 (p<0.01). Broilers fed 50 mg/kg or 100 mg/kg LA had lower L* value (p<0.01), broilers fed 100 mg/kg LA had lower pH 24 h (p<0.01) than that of no LA treatment. Addition of ALC to broiler’s feed had significant impact on muscle color, Broilers fed 50 mg/kg or 100 mg/kg ALC had lower L* value, a* value, and b* value (p<0.01) than that of no ALC treatment. There existed an interaction between LA and ALC in breast muscle meat quality of broilers. The general trend was that high level of LA and ALC resulted in lower L* value, a* value, and b* value.

Effects of dietary LA and ALC on the breast muscle meat quality of broilers
The effects of dietary LA and ALC on the thigh muscle meat quality of broilers are presented in Table 5. Addition of LA to broiler’s feed had significant impact on L* value and pH24 (p<0.01), Broilers fed 50 mg/kg or 100 mg/kg LA had lower L* value (p<0.01), broilers fed 50 mg/kg LA had higher pH24 (p<0.01) than that of no LA treatment. Addition of ALC to broiler’s feed had significant impact on muscle color, Broilers fed 50 mg/kg or 100 mg/kg ALC had lower L* value (p<0.01), and had higher pH24 (p<0.01) than that of no LA treatment, and there was a significant decrease in trend of b* value, and increase in trend of pH 45 min. There existed an interaction between LA and ALC in thigh muscle meat quality of broilers. The general trend was that high level of LA and ALC resulted in lower L* value (p<0.05) and b* value, higher a* value, pH 45 min and pH24 (p<0.01).
Effects of dietary LA and ALC on the thigh muscle meat quality of broilers
DISCUSSION
Shen reported that dietary LA decreased (p<0.05) weight gain in mice during the second and third weeks compared with no LA treatment, the decrease in feed consumption following LA supplementation could not be attributed to taste aversion to diets because an intraperitoneal injection of LA caused a similar decrease in feed consumption (Shen et al., 2005). Dietary LA significantly decreased (p<0.05) ADG and AFI of pigs, and these results might be caused by inhibition of feed intake by the disulfide bond in the LA molecule (Maddock et al., 2001). Tanaka et al. (2004) observed that three-month administration of ALC to aged rats (initially 19 months old) decreased mean body weight from 439±19 g to 417±16 g. Addition of LA to broiler’s feed resulted in lower ADG and feed intake (Zhang et al., 2009), Broilers fed ALC had decreased ADG and feed intake (Zhang et al., 2010). In this study, broilers fed both LA and ALC had the similar responses in growth performance to the addition of either LA or ALC alone. With the incremental increase of supplementing amount of LA and ALC, broilers had a lower growth performance.
Schmidt found that LA supplementation did not affect carcass weight, dressing percentage, whereas dietary LA decreased abdominal fat percentage of broilers compared to that of control treatment in the present experiment (Schmidt et al., 2005). Dietary LA had no significant effects on dressing percentage, breast muscle percentage and thigh muscle percentage (Zhang et al., 2009). No differences in dressing percentage and breast or thigh muscle percentages were observed in broilers fed ALC (Zhang et al., 2010). But in this study, addition of both LA and ALC had a significant effect on eviscerated rate and thigh muscle percentages, the results indicated that there existed interaction between LA and ALC in carcass characteristics of broilers. The effect of dietary LA and ALC on abdominal fat percentage of broilers in this study was consistent with addition of LA or ALC alone to broiler’s feed (Zhang et al., 2009; Zhang et al., 2010). The result was supported by Reed (1973), who thought that lipoamide dehydrogenase was the flavoprotein component of the α-keto acid, and which was involved in Krebs cycle promoting energy metabolism.
The color of meat is one of the most important quality attributes of meat product for consumer acceptance. Yellowness (b*) value is mainly affected by the forms of presented myoglobin (Lindahl et al., 2001). Boulianne and King (1995, 1998) reported that pale fillet had significantly greater lightness value, less redness and greater yellowness, whereas dark fillets had lower lightness and yellowness. In the current study, dietary LA and ALC had decreasing trend in breast muscle a* value, breast muscle and thigh muscle L* value, and b* value, whereas had increasing trend in thigh muscle a* value. For breast muscle, reduction of lightness (L*) and yellowness (b*) values and increase of redness (a*) value contribute to the acceptability of meat. The change in trend of a* value is opposite between thigh muscle and breast muscle in the present study, the possible reason is that the difference of myofiber types or fatty acid composition between these two muscles. Further detailed research into the reason is required.
There is an increased trend of the ultimate pH value of postmortem muscle, which is consistent with the elevation in pH at 45 min the LM of pigs fed supplemental LA (Berg et al., 2003). Dietary LA increased pH value in postmortem mice muscle (Shen and Du, 2005). Our study supports the former report. In the present experiment, breast muscle and thigh muscle pH values at 24 h postmortem increased.
In conclusion, the results presented in this study indicated that dietary LA and ALC had significant effects on growth performance, carcass traits and meat quality. These parameters showed that dietary LA and ALC partially improve meat quality of broilers. Compared with LA or ALC alone, there are interaction between LA and ALC in growth performance and meat quality of broilers. According the results, two compounds used in the broiler diets respectively is 50 mg/kg LA and 50 mg/kg ALC.
ACKNOWLEDGMENTS
We are appreciative for the Financially Supported by Starting Research Fund from Henan University of Technology (Project No: 2010BS055) and Open Project of State Key Laboratory of Animal Nutrition (Project No: 2004DA125184F1112).