Genetic Traceability of Black Pig Meats Using Microsatellite Markers
Article information
Abstract
Pork from Jeju black pig (population J) and Berkshire (population B) has a unique market share in Korea because of their high meat quality. Due to the high demand of this pork, traceability of the pork to its origin is becoming an important part of the consumer demand. To examine the feasibility of such a system, we aim to provide basic genetic information of the two black pig populations and assess the possibility of genetically distinguishing between the two breeds. Muscle samples were collected from slaughter houses in Jeju Island and Namwon, Chonbuk province, Korea, for populations J and B, respectively. In total 800 Jeju black pigs and 351 Berkshires were genotyped at thirteen microsatellite (MS) markers. Analyses on the genetic diversity of the two populations were carried out in the programs MS toolkit and FSTAT. The population structure of the two breeds was determined by a Bayesian clustering method implemented in structure and by a phylogenetic analysis in Phylip. Population J exhibited higher mean number of alleles, expected heterozygosity and observed heterozygosity value, and polymorphism information content, compared to population B. The FIS values of population J and population B were 0.03 and −0.005, respectively, indicating that little or no inbreeding has occurred. In addition, genetic structure analysis revealed the possibility of gene flow from population B to population J. The expected probability of identify value of the 13 MS markers was 9.87×10⁻¹⁴ in population J, 3.17×10⁻⁹ in population B, and 1.03×10⁻¹² in the two populations. The results of this study are useful in distinguishing between the two black pig breeds and can be used as a foundation for further development of DNA markers.
INTRODUCTION
In Korea, fresh pork is popular for use in a wide variety of dishes. With this arises a demand for high quality fresh pork with high marbling. In Japan, the retail price of purebred Berkshire meat is 50% higher than that of regular commercial pork meat (three-way crossbred pigs) (Suzki et al., 2003). Similarly in Korea, black pork, mostly from Berkshire and Jeju Black pig, is sold at a higher price than regular commercial pork.
Previous studies of black pig meat revealed a higher glutamic acid content and higher red muscle fiber content than other commercial breeds. The level of glutamic acid is known to be a major factor in flavor (Moon et al., 2004) while the red muscle fiber content is thought to confer tenderness to the meat (Song et al., 2010). In addition, it was reported that black pig meat, especially from Berkshire, possesses high marbling, drip loss and water holding capacity (Lee et al., 2011). Due to these characteristics, the black pig meat is in high demand in Korea.
Recently, the Korean public has started to pay attention to the origin of the food it consumes. To provide the consumers with the necessary information, the potential of using DNA-based methods for the identification of meat has been extensively explored (Dalvit et al., 2007; 2008). Several types of DNA markers have been tested for use in traceability systems in livestocks, including mitochondrial DNAs (Alves et al., 2009), microsatellites (Kim et al., 2007), and SNPs (Goffaux et al., 2005; Negrini et al., 2008; Shim et al., 2010). A traceability system based on DNA technology has already been enforced for Korean beef since 2009 in Korea. To consider expanding this use of genetic identification system to pork, the Korean government has formed a committee to consider suitable methods for implementing a traceability system. In addition, multiple providers supply the market with black pig meat in Korea and the use of a genetic system to distinguish between different stocks will also enhance the brand power of the suppliers.
With the goal of developing a genetic tool for the identification of pig meat, the objective of this study was to identify markers with sufficient genetic information to discriminate between the two main black pig populations in Korea. A total of 13 microsatellite (MS) markers were tested in Jeju black pig and Berkshire, and levels of genetic diversity in each breed were estimated for future use in breeding.
MATERIALS AND METHODS
Sample collection and DNA extraction
Muscle samples were collected between September of 2012 and April of 2013 from two slaughter houses; one in Jeju Island for population J (n = 800) and the in Namwon, Korea, for population B (n = 351). Population J is known to have a mixed genetic background with possible cross-breeding with either Duroc or Berkshire and Korean native pig. Population B consists of pure Berkshire breed, which was established in Korea since 2004.
Total genomic DNA was extracted using the salting-out procedures (Miller et al., 1988). DNA quality and quantity were measured with UV-spectrophotometer.
Microsatellite marker genotyping
In this study, we selected 13 swine microsatellite markers to analyze the genetic polymorphisms of the two pig populations (Table 1). Among 13 markers, 10 markers were recommended by ISAG/FAO (2011) and 3 markers, i.e., S0225, SW951 and SW787, which were recommended by Roslin Institute (University of Edinburg, UK) for pig genetic diversity studies. Also, these markers were previously used for individual identification and parentage analysis in commercial pigs in Korea (Lim et al., 2009). Polymerase chain reaction (PCR) was performed in 15 μL volume containing of 1 μL of 100 ng of genomic DNA, 0.5 μL of 10 pmole of each primer, 1.5 μL of 10×PCR buffer (10 mM Tris-HCl, 50 mM KCl, 1.5 mM MgCl2, pH 8.3), 1.5 μL dNTP (2.5 mM), and 0.2 μL Taq polymerase (10 unit/ μL) (GENETBio, Daejeon, Korea). Thermal cycling conditions in GeneAmp PCR System 9700 (ABI thermal cycler, Foster city, CA, USA.) included an initial denaturation for 5 min at 94°C, followed by 35 cycles of 30 s at 94°C, 30 s at the annealing temperature, 1 min at 72°C, and a final extension step of 10 min at 72°C. The amplified products were visualized on 2% agarose gels stained with ethidium bromide (0.5 μg/mL). Genotyping was performed on ABI 3130 Genetic Analyzer (Applied Biosystems, Foster city, CA, USA).

List of microsatellite markers used in this study
Statistical analyses
The number of alleles, observed heterozygosity (HOb), expected total heterozygosity (HEx), and polymorphic information content (PIC) were calculated using MS toolkit software (Park, 2000). Pairwise FST and inbreeding coefficients (FIS and FIT) were calculated using the program FSTAT (Goudet, 2001). The clustering method (Saitou and Nei, 1987) was used to construct a phylogenetic tree based on the genetic distance matrix in Phylip package version 3.67 (Felsenstein, 2007). To assign individuals to populations using genotype data, a Bayesian approach was used in the program structure (Pritchard et al., 2000). The expected probability of identity (PI) value among genotypes of random individuals was calculated using API-CALC version ver 1.0 (Ayres and Overall, 2004).
RESULTS AND DISCUSSION
Genetic diversity of the two black pig populations
We genotyped 1,151 black pig samples, 800 Jeju black pigs (J) and 351 Berkshires (B), with 13 MS markers. These markers were recommended by ISAG for both breed and individual identification in pigs. Furthermore, the markers have been validated by a previous study on breed identification and origin tracking for pork meat in Korea (Lim et al., 2009).
The expected HEx, HOb, and PIC are important parameters for the selection of markers for pig breed identification. In general, mean number of alleles per locus (MNA), heterozygosities (HEx and HOb), and PIC value of population J were higher than those of population B (Table 2). The MNA of population J and B was 8.23 and 5.08, respectively. HEx of population J was 0.706, whereas that of population B was 0.541. Population J showed a higher PIC value than population B (0.668 vs 0.486).
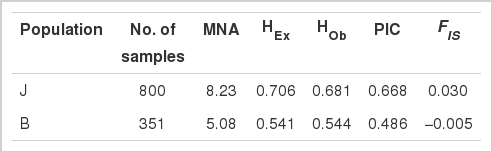
Number of samples, mean number of alleles (MNA) per locus, expected heterozygosity (HEx) at Hardy-Weinberg equilibrium, observed heterozygosity (HOb), polymorphism information content (PIC) and inbreeding coefficient (FIS) of the two black pig populations
Genetic makers for identification of breed need to have sufficient genetic diversity and power. A previous study has indicated that for successful individual identification, PIC and HEx values need to be higher than 0.5 and 0.6, respectively (Botstein et al., 1980).
HEx of the two pig populations combined ranged from 0.416 (S0225) to 0.855 (S005), and PIC value ranged from 0.338 (S0225) to 0.840 (S005) for individual markers. Mean HEx and PIC were 0.688 and 0.650, respectively (Table 3). A few markers, S0225, SW951, SW026, appeared to be less polymorphic than others. On the contrary, some markers, such as S005, SW857, SW122, and SW632, showed higher genetic diversity and information making them especially useful for traceability tests. In population J, HEx values ranged from 0.484 (SW951) to 0.884 (S005), while in population B, they ranged from 0.146 (SW0225) to 0.772 (SW24) (Table 4). The highest PIC value was seen in marker S005 (0.873) for population J, while for population B, it was marker SW24 (0.743) (Table 4). Marker S0225 showed the lowest PIC value for both population J and P with 0.447 and 0.136, respectively. These analyses demonstrated that 10 out of 13 MS markers tested may provide a reasonable amount of genetic diversity and information to be suitable for use in breed identification.

Measures of genetic diversity for the 13 microsatellite markers

Statistical analysis of heterozygosity (HEx and HOb), PIC and gene differentiation within population (FIS) of two black pig populations using 13 microsatellite markers
Analyses of Wright’s F-statistics were carried out using FASTA (version 2.9.3) and the results are presented in Table 3. The global heterozygosity deficit between two black pig populations was estimated by FIT using the 13 MS markers. The mean FIT and FST among the markers were 0.126 and 0.194, respectively. FIT value was the highest for SW122 (0.191), while it was the lowest for SW0026 (0.022). FST value of SW122 was the highest (0.175) and that of SW0026 was the lowest (0.026) (Table 3).
The inbreeding coefficient, FIS, reflects the degree of inbreeding in a population by measuring the loss of heterozygosity within a population. FIS ranged from −0.054 (SW857) to 0.120 (S0005) and the mean FIS of the 13 markers was 0.025 (Table 3). Table 4 shows the FIS values for population J (0.03) and population B (0.005), which suggests that little or no inbreeding has occurred within the two populations. This is most likely due to the fact that both populations have been under managed breeding systems.
Phylogenetic and structure analyses
An individual-based neighbor-joining dendrogram was built from the estimates of allele-sharing distances among the 400 individuals which consisted of 200 Jeju black pigs and 200 Berkshires (Figure 1). Based on the equation of Nei et al. (1983), a phylogenetic tree was estimated by the distribution of allele sharing by genetic distance (FST). The two black pig populations were clearly distinguishable by MS markers. Population J showed a large genetic distance from population B. This indicates that although the two populations share a coat color, they are genetically distinct from each other. We observed that the distance between the branches in population J was greater than that of population B. This suggests that population J should have a greater variation than population B.
A neighbor joining dendrogram was constructed from allele-sharing distances among 400 individuals in the two pig populations. J: Jeju black pigs, B: Berkshire pigs.
We estimated the expected PI values of the 13 MS markers in random individuals in the two black pig populations (Table 5). The expected PI from was 9.87×10⁻¹⁴ and 3.17×10⁻⁹ for population J and population B, respectively. Kim et al. (2007) reported that analysis among 4 pig breeds (Duroc, Landrace, Yorkshire and Korean native pig) with 10 MS markers resulted in an expected probability of identify value of 0.36×10⁻⁹. In our study, the expected probability of identify value was estimated to be 3.87×10⁻¹¹ with 10 markers. In another study of 400 pigs with a three-way cross (Landrace×Large White×Duroc), the expected probability of identify value was estimated to be 2.47×10⁻¹⁸ (Lim et al., 2009). Therefore, the results of this study are reliable when compared to previous studies. In summary, the expected PI value was 1.03×10⁻¹² with 13 MS markers in 1,151 black pigs (Table 5).
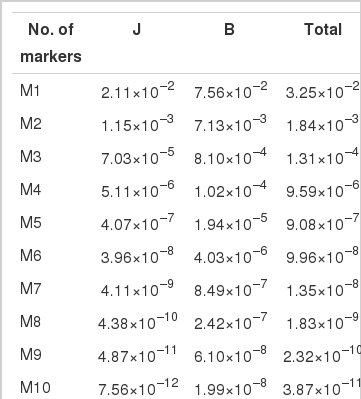
The expected PI values among genotypes of random individuals for discriminating between the two pig populations
The result of the structure analysis when K = 2 is shown in Figure 2. Each breed grouped into its own cluster; however, there were signs of gene flow from population B into population J. The possibility of cross breeding between the two populations is supported by the breeding history (Moon, 2004).
Clustering assignment of the two pig populations obtained by structure analyses. Each of the 400 animals is represented by a thin vertical line that is divided into segments whose size and color correspond to the relative proportion of the animal genome corresponding to a particular cluster. Panel with K = 2 inferred clusters, J (Jeju black pigs) and B (Berkshire) populations are discriminated.
CONCLUSION
In this study, we analyzed 1,151 muscle samples from two black pig populations with 13 MS markers. The chosen MS markers’ ability to identify the breed of the meat was analyzed by estimating the genetic diversity and population structure of the two populations. While the two breeds are difficult to differentiate phenotypically due to the same coat color, we found that 10 out of 13 MS markers can be used to genetically distinguish between the two breeds.
These markers can also be used to complement the conventional traceability system based on meat cut labeling. A genetic traceability system will be useful for identifying black pig meat products in the market to prevent fraud and mislabeling. However, trade-off between economic viability and sufficient identification power need to be considered for the selection of a subset of MS markers for a practical traceability system.
ACKNOWLEDGMENTS
This study was supported by a grant from the Next Generation BioGeen 21 program (No. PJ008196, PJ009032), Rural Development Administration, Republic of Korea.