Evaluation of a Nutrition Model in Predicting Performance of Vietnamese Cattle
Article information
Abstract
The objective of this study was to evaluate the predictions of dry matter intake (DM) and average daily gain (ADG) of Vietnamese Yellow (Vang) purebred and crossbred (Vang with Red Sindhi or Brahman) bulls fed under Vietnamese conditions using two levels of solution (1 and 2) of the large ruminant nutrition system (LRNS) model. Animal information and feed chemical characterization were obtained from five studies. The initial mean body weight (BW) of the animals was 186, with standard deviation ±33.2 kg. Animals were fed ad libitum commonly available feedstuffs, including cassava powder, corn grain, Napier grass, rice straw and bran, and minerals and vitamins, for 50 to 80 d. Adequacy of the predictions was assessed with the Model Evaluation System using the root of mean square error of prediction (RMSEP), accuracy (Cb), coefficient of determination (r2), and mean bias (MB). When all treatment means were used, both levels of solution predicted DMI similarly with low precision (r2 of 0.389 and 0.45 for level 1 and 2, respectively) and medium accuracy (Cb of 0.827 and 0.859, respectively). The LRNS clearly over-predicted the intake of one study. When this study was removed from the comparison, the precision and accuracy considerably increased for the level 1 solution. Metabolisable protein was limiting ADG for more than 68% of the treatment averages. Both levels differed regarding precision and accuracy. While level 1 solution had the least MB compared with level 2 (0.058 and 0.159 kg/d, respectively), the precision was greater for level 2 than level 1 (0.89 and 0.70, respectively). The accuracy (Cb) was similar between level 1 and level 2 (p = 0.8997; 0.977 and 0.871, respectively). The RMSEP indicated that both levels were on average under- or over-predicted by about 190 g/d, suggesting that even though the accuracy (Cb) was greater for level 1 compared to level 2, both levels are likely to wrongly predict ADG by the same amount. Our analyses indicated that the level 1 solution can predict DMI reasonably well for this type of animal, but it was not entirely clear if animals consumed at their voluntary intake and/or if the roughness of the diet decreased DMI. A deficit of ruminally-undegradable protein and/or a lack of microbial protein may have limited the performance of these animals. Based on these evaluations, the LRNS level 1 solution may be an alternative to predict animal performance when, under specific circumstances, the fractional degradation rates of the carbohydrate and protein fractions are not known.
INTRODUCTION
Proper ration formulation is required to ensure satisfactory animal performance (e.g. meat, milk, egg production), to adequately plan for long-term financial stability, and competitiveness in the agriculture market. Therefore, decision support systems (DSS) that allow for ration formulation and evaluation are needed (Tedeschi et al., 2005b). Furthermore, adequate testing of the DSS is necessary to verify that the tool will work satisfactorily under the desired production conditions (Tedeschi, 2006).
Cattle production in Vietnam has increased significantly during the last decade, with annual cattle population growth of around 6.3% (General Statistics Office, 2010). Cattle are mainly kept by smallholder farmers with herd sizes of 3 to 4 animals. The dominant feeding system is grazing of native grass on common land (uncultivated land or harvested crop fields with native grasses), often supplemented with crop by-products and cut-and-carry sown or native grasses (Ba et al., 2008c; Von et al., 2009). Recently, with increasing demand for beef, some farmers are finishing their beef cattle for several months before selling. With this system, beef cattle are fed concentrate supplements in addition to a basal diet of forages and crop by-products. A series of experiments and on-farm testing of supplementary feeding strategies for cattle finishing in Vietnam (Ba et al., 2008a, b; Van et al., 2008) indicated there is potential to improve growth rates of local beef cattle and efficiency of feed utilisation by formulating concentrate mixes, implementing more consistent feeding practices, and feeding greater amounts of supplement. An economic analysis of these strategies revealed increased profit for farmers, compared with their traditional practices.
Feed resource planning for ruminant livestock production involves: knowing how much and what type of feeds are likely to be available; having information on their nutritive characteristics; understanding the animal’s nutrient requirements for particular purposes; and using this information to design feeding strategies (Doyle et al., 2008). Although feed planning principles are commonly applied in temperate agriculture (e.g. to design diets for confinement production systems, to set carrying capacity, or to decide on calving times in grazing systems), such principles are poorly understood and not currently applied in Vietnam or numerous other countries in South East Asia. In addition, seasonal climate variation and its effect on feed availability is a big challenge for farmers interested in designing effective cattle feeding strategies. For these reasons, there is a need for DSS to help researchers, extension personnel, and farmers to make successful feed management decisions. Such a DSS needs to be based on a well functioning nutrition model that can adequately predict intake and growth of yellow cattle offered typical available feeds.
Therefore, the objective of this paper was to evaluate the ability of a mechanistic nutrition model to predict the dry matter intake (DMI) and average daily gain (ADG) of Vietnamese Yellow (Vang) cattle fed under specific Vietnamese conditions.
MATERIALS AND METHODS
Database description and calculations
A database was built based on the information from five studies in which adequate feed and animal characterizations were available. A summary of the studies used in our evaluation is shown in Table 1. Feed and concentrate mix samples of these studies were analysed by a commercial laboratory (Cumberland Valley Analytical Services, Hagerstown, MD) for dry matter (DM; AOAC, 2000; method 930.15), ash (AOAC, 2000; method 942.05), crude protein (CP; AOAC, 2000; method 990.03), lignin (sa) determined by solubilisation of cellulose with sulphuric acid, neutral detergent fibre (aNDF; Van Soest et al., 1991), acid-detergent insoluble protein (ADIP; Licitra et al., 1996) and neutral-detergent insoluble protein (NDIP; Licitra et al., 1996), and ether extract (EE; AOAC, 2006; method 2003.05). The characterization for commonly-fed feeds is detailed in Table 2. The large ruminant nutrition system (LRNS) version 1.0.17 (http://nutritionmodels.tamu.edu/lrns.htm) was used to predict animal intake and performance. The LRNS is based on the Cornell Net Carbohydrate and Protein System (CNCPS) version 5.0.40 (Fox et al., 2004). The fractional degradation rates (kd) and other feed characterization needed for the level 2 solution of the LRNS were obtained from similar feeds available in the feed library of the LRNS as documented by Tedeschi et al. (2002). Table 3 lists the animal parameters used to simulate the studies.
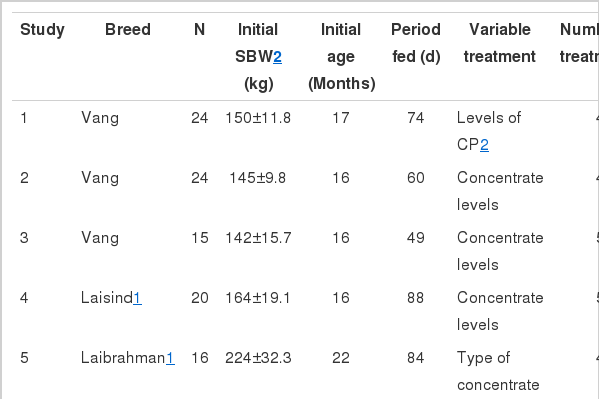
Summary of studies used for evaluating the large ruminant nutrition system for Vietnamese Yellow (Vang) purebred and crossbred cattle fed under Vietnamese conditions

Feed quality values for selected samples from the five studies used to evaluate the large ruminant nutrition system model
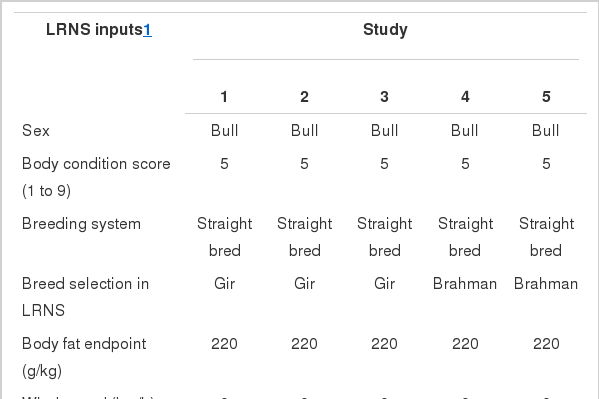
Input variables and their values used to simulate five studies used to evaluate the large ruminant nutrition system (LRNS) model
The energy and protein requirements for ADG are computed based on the composition of the body of the animals. The LRNS uses a scaling factor as described by Tylutki et al. (1994) to compute the net energy (NE) for growth. However, to perform this body weight (BW) scaling and to compute the equivalent BW, the body composition (i.e. fat) of the target cattle at a given BW is needed. One of the earliest and most comprehensive reports on fat distribution in bovine carcass of different BW ranges was reported by Johnson et al. (1972). They concluded that there was the need for precise definition of fat distribution patterns in breeds and types of cattle in order that carcasses of optimum composition could be produced. Later, Berg et al. (1978a, b) found that although partitioning differences occurred among different biological types, fat deposition followed a common pattern among genetic types of cattle and, at equal amounts of total carcass fat, differences in fat distribution are minor. This concept is supported by the studies of Jones et al. (1980) and Belk et al. (1991). More recently, other studies (McPhee et al., 2008; Wang et al., 2009; Fernandes et al., 2010) have indicated the generally reported ratio of 1 kg of subcutaneous fat to 1.6 kg of intermuscular fat and a deposit of 720 to 760 g/kg of body fat in the carcass of beef cattle equates to about 50 g/kg of physically separated fat at approximately 230 kg live BW. Using the equation proposed by Guiroy et al. (2001) and adding 45 kg to account for extended periods at slow rates of gain (National Research Council, 2000), the adjusted final shrunk BW calculated was 532 kg for the Vietnamese Yellow (Vang) cattle with 220 g/kg of empty body fat.
Level 1 and level 2 solutions of the LRNS model were used to predict DMI and the metabolisable energy (ME) and protein (MP) allowable gain. The first limiting factor (either ME or MP allowable gain) was used in our evaluations. As discussed by Tedeschi et al. (2005a) the level 1 of the LRNS uses a summative empirical equation (Conrad et al., 1984; Weiss et al., 1992; Weiss, 1993) to compute total digestible nutrients (TDN), ME supply, and NE for maintenance (NEm) and growth (NEg), and MP supply is estimated using the level 1 equation recommended by the NRC (2000). The level 2 of the LRNS uses feed carbohydrate and protein fractions and their predicted gastro-intestinal tract digestion (rumen and intestinal digestions) to estimate TDN and subsequently dietary ME and NEm and NEg. The MP supply is computed using the protein fractions and their digestibility. Ruminal digestion is computed using the fractional rate of degradation and passage (kp) for each fraction of each feed. The prediction of DMI was based on the empirical equation developed by the NRC (2000).
Study description
Study 1 (Ba et al., 2010a) evaluated the levels of dietary CP on animal performance and digestibility. The study was conducted on 24 intact male Vietnamese Yellow (Vang) cattle, 17 months old, and 150±11.8 kg of initial BW in a randomized complete block design with 4 treatments and 6 blocks. Treatments were 101; 132; 169 and 202 g/kg CP in the concentrate, respectively for 91; 107; 126 and 143 g/kg CP in the diets. Concentrate composed of rice bran, maize, cassava powder, fish meal, urea, salt, and vitamin-mineral premix. Animals were offered a daily concentrate allowance of 15 g/kg of BW and 5 kg Bermuda grass (Cynodon dactylon L. Pers.) during the day and rice straw was provided ad libitum during the night. The experiment lasted for 74 d during which time the DMI was measured daily.
Study 2 (Ba et al., 2010b) involved different levels of a concentrate fed to Vang cattle for 60 d. The 4 treatments were defined by concentrate offered as a percentage of BW (10, 14, 18, and 22 g/kg). Six animals were used per treatment. Twenty four intact male cattle, 16 months old and averaging 145±9.8 kg of initial BW, were used in a randomized complete block design with 6 blocks. The concentrate (CP 157 g/kg) was a mixture of rice bran, maize, cassava powder, fish meal, urea, salt, and vitamin-mineral premix. Similar to study 1, rice straw was fed ad libitum at night and Bermuda grass was restricted at 5 kg/d.
Study 3 (Ba et al., 2008a) was similar to study 2; fifteen intact male cattle, 16 months old and averaging 142±15.7 kg of initial BW were divided into 5 treatments (3 animals per treatment) based on five levels of a concentrate mix (0, 3.3, 6.6, 13.2, and 19.8 g/kg of BW as DMI). Cattle were fed Bermuda grass at 12.5 g/kg of BW during the day and rice straw ad libitum at night. The concentrate mix contained 174 g/kg CP. The study lasted for 49 d.
In study 4 as described by Ba et al. (2008b), the effects of different levels of cassava powder containing 20 g/kg urea on the performance of Vang×Red Sindhi crossbred cattle (Laisind) were investigated for 88 days. Five treatments (0, 3.3, 6.6, 13.2, and 19.8 g/kg of BW as DMI of a concentrate mix) plus ad libitum rice straw at night and 12.5 g/kg of BW of DMI of Napier grass were used. Twenty intact male Laisind cattle, 16 months old and with an average initial BW of 164±19.1 kg were assigned to the five treatments (4 animals per treatment).
Study 5 (Van et al., 2012) was conducted with sixteen intact Vang×Brahman crossbred (Laibrahman) males, 22 months old with an average initial BW of 224±32.3 kg. Animals were assigned into 4 treatment groups in a completely randomized design, conducted for 84 d. Animals were fed Napier grass (Pennisetum purpureum Shumach.) ad libitum, and offered different concentrate mixtures at 15 g/kg BW according to the treatment. Concentrate ingredients for treatment 1 were rice bran 490 g/kg, corn powder 300 g/kg, cassava powder 200 g/kg, and salt 10 g/kg; treatment 2 was comprised of rice bran 200 g/kg, corn powder 485 g/kg, cassava powder 200 g/kg, fish meal 100 g/kg, salt 50 g/kg, and urea 10 g/kg; treatment 3 was comprised of rice bran 200 g/kg, corn powder 390 g/kg, cassava powder 200 g/kg, and fish meal 210 g/kg. Cattle in treatment 4 were fed an industry concentrate (Lai Thieu Company, Vietnam) which consisted of corn, rice bran, peanut cake, cassava, fish meal, shell powder, methionine, lysine, minerals, vitamins, and enzymes. The crude protein in the concentrate of treatment 1 was 94 g/kg, while in the other concentrates it was about 155 g/kg.
Model evaluation
The Model Evaluation System (MES; Tedeschi, 2006; http://nutritionmodels.tamu.edu/mes.htm) was used to test for LRNS adequacy as discussed by Tedeschi (2006) in which model-predicted and observed treatment mean values were analysed for accuracy and precision using several statistics. These statistics included the mean square error of prediction (MSEP) and its components, the root of MSEP (RMSEP), concordance correlation coefficient (CCC), accuracy (Cb), coefficient of determination (r2) of the linear regression between observed and model-predicted values, and mean bias (MB). Briefly, the CCC is the multiplication of the correlation coefficient between observed and predicted values by the Cb, which is computed based on the standard deviation and mean of observed and predicted values as shown in Equation (1) (Tedeschi, 2006). The CCC, r, and Cb statistics vary from 0 to 1.
Where CCC is concordance correlation coefficient; r is the correlation coefficient between observed and predicted values; Cb is the bias correction (accuracy); s1 and s2 are the standard deviation for observed and predicted values, respectively; and x1 and x2 are the mean for observed and predicted values, respectively.
The MSEP also assess the accuracy of the model predictability and it is calculated as the average of the squared differences between observed and predicted values whereas the MB is the difference between the means of the observed and predicted values. Predictions with level 1 and 2 were also compared using the delta Akaike’s information criterion (ΔAIC), which is the difference between 2 AIC statistics. The ΔAIC is used to identify which model is more likely to be correct through a probability calculation (Tedeschi, 2006).
RESULTS
Table 4 contains the descriptive and adequacy statistics comparing observed and model-predicted DMI and ADG using levels 1 and 2 of the Large Ruminant Nutrition System.
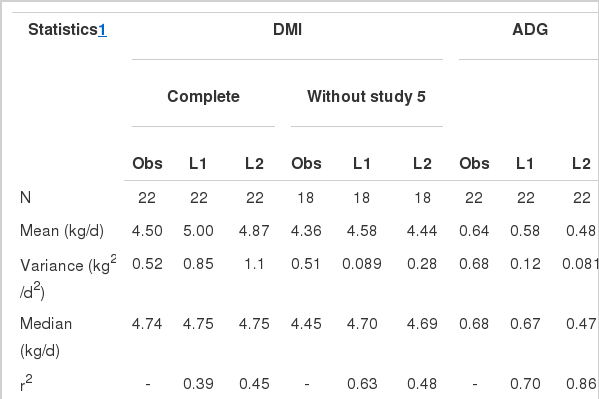
Descriptive and adequacy statistics of observed (Obs) versus first-limiting model-predicted average daily gain (ADG, kg/d) and observed versus model-predicted dry matter intake (DMI, kg/d) using level 1 (L1) or level 2 (L2) solutions of the large ruminant nutrition system
Dry matter intake
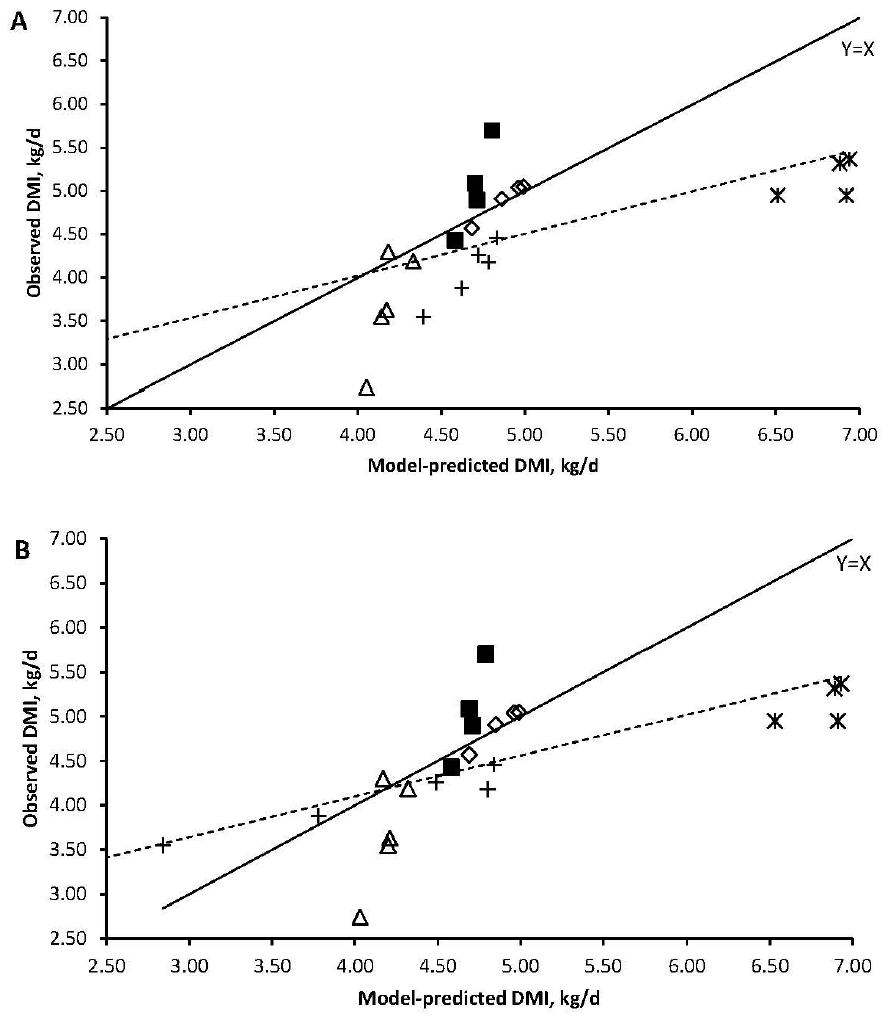
Figure 1 depicts the observed versus model-predicted DMI for levels of solution 1 and 2. As presented in Table 4, when all treatment means were used, both levels of solution predicted DMI similarly with low precision (r2 of 0.39 and 0.45 for level 1 and 2, respectively) and medium accuracy (Cb of 0.83 and 0.86, respectively). The errors of the MSEP were fairly evenly divided among MB, systematic bias, and random errors, with no clear pattern. On average, the level 1 and 2 solutions overpredicted DMI by 0.49 and 0.37 kg/d. Figure 1 shows that animals in study 5 consumed less than predicted, decreasing the adequacy of the LRNS. When this study, which had larger cattle, was removed from the comparison (Table 4), the precision and accuracy drastically increased for the level 1 solution. Even though the level 2 solution improved slightly, it was inferior to the level 1 solution. For either solution, the MSEP decreased by more than half when study 5 was removed. Zhao et al. (2008) reported a greater precision (r2 = 0.82) for DMI prediction by the CNCPS model than our study for a similar type of animal. Similarly, Du et al. (2010) indicated the CNCPS model can accurately predict DMI of crossbred bulls under a traditional confined feeding system in China.
Average daily gain
Using the level 1 solution, 16 out of 22 ADG predictions were limited by MP rather than ME. For level 2 prediction, 15 out of 22 ADG predictions were limited by MP. These results suggest that for more than 68% of the treatment averages, MP was limiting ADG. Figure 2 shows that for studies 1, 2, and 3, average RNB was consistently positive between level 1 and 2 solutions; whereas for study 5 RNB was slightly negative for both solutions. The RNB for study 4 was positive for the level 1 solution, but negative for the level 2 solution, likely due to the fast fractional degradation rate of cassava.
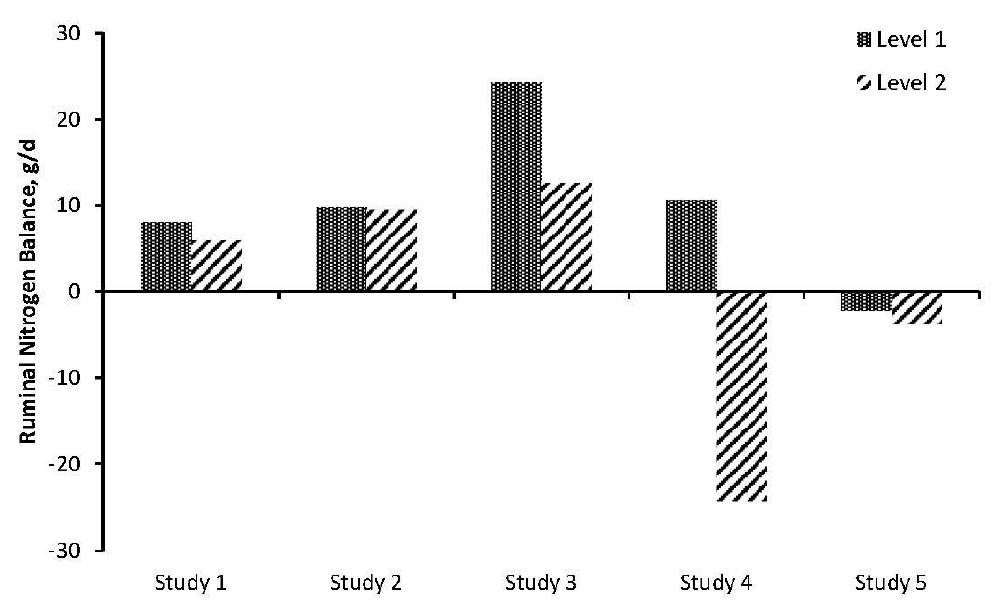
Model-predicted ruminal nitrogen balance using level 1 (dotted bars) or level 2 (hashed bars) solutions of the Large Ruminant Nutrition System for each study, averaged across treatments.
Figure 3 depicts the relationship between observed and the first-limiting model-predicted ADG. The first-limiting factor is the least between model-predicted ME- and MP-allowable ADG using level 1 and level 2 solutions. Both levels differed regarding precision and accuracy. While level 1 solution had a lower MB than level 2 (0.058 and 0.16 kg/d, respectively), the precision was greater for level 2 than level 1 (0.86 and 0.70, respectively) (Table 1). The accuracy (Cb) was similar between level 1 and level 2 (p = 0.8997; 0.98 and 0.87, respectively). The AIC was less for level 2 than level 1 (−92.2 and −75.7, respectively), indicating that level 2 is more than 3,800 times more likely to minimize information loss, and therefore have better goodness of fit than level 1 (likelihood probability of 99.7%). Most of the errors in level 1 were associated with random errors (71%) whereas for level 2 they are associated with MB (67%) (Table 4). This suggests that the predictions of level 2 could be adjusted to remove the observed MB. In fact, level 2 MB was 24.8% greater than the average observed ADG. The linear regression shown in Figure 3B indicated that the slope did not differ from unity (p = 0.821) whereas the slope in Figure 3A is different from unity (p = 0.0278). This is in agreement with the composition of the MSEP (Table 4) in which systematic bias account for only 0.085% of the total MSEP for the level 2 solution.

Relationships between observed and first-limiting model-predicted average daily gain (ADG) using level 1 (A) or level 2 (B) solutions of the Large Ruminant Nutrition System. Symbols are studies 1 (⋄), 2 (■), 3 (A), 4 (+), and 5 (✳). Solid line is the Y = X and the dotted line is the linear regression.
Even though level 1 had approximately 3 times less MB (Table 4), the RMSEP indicated that both levels were on average under- or over-predicted by about 190 g/d (RMSEP of 191 and 193 kg/d for level 1 and 2, respectively), suggesting that even though the accuracy (Cb) was greater for level 1 compared to level 2, both levels are likely to wrongly predict ADG by the same amount because the RMSEP were identical.
DISCUSSION
Dry matter intake
Our analyses indicated that the level 1 solution over-predicted DMI with low to moderate precision (r2 between 0.39 and 0.63) for this type of animal and selection of feeds. In the LRNS, DMI for growing cattle is predicted based on metabolic shrunk BW (SBW) and diet NEm content (Fox et al., 2004). The discrepancy between observed and model-predicted DMI for study 5 was likely due to the heavier BW of the animals. Despite their greater BW, their DMI was comparable to the DMI of animals from the other studies (Figure 1). In addition, animals from study 5 received more than 650 g/kg (DM basis) of their intake as concentrate. There are several factors that might have caused this discrepancy in the DMI prediction. In studies 1, 2, 3 and 4, the animals in each treatment were fed some concentrates and had ad libitum access to fresh grass and rice straw. On the other hand, all animals in study 5 regardless of treatment group, were fed the same level (1.5% body weight) of different kinds of concentrates and elephant grass ad libitum. Digestibility trials showed that the total ration in study 5 was of much higher quality than the other experiments. The theoretical expectation was that there would have been a much higher rate of nutrient passage from the abomasum and less retention time in the rumen, thus making the animals want to consume more of the feed - higher dry matter intake. However, the DMI was lower than predicted in study 5 animals contrary to expectation. The major reason for this observation lies in the high levels and energy density of the concentrates which led to a high turn-over rate and synthesis of volatile fatty acids that quickly met the satiety requirements of the animals. That way, by consuming a little of the feed, the animals were satisfied, hence the observed lower dry matter intake than predicted. This is in agreement with the observations of Vu Duy Giang et al. (2008) in Vietnamese cattle when they were fed excess concentrates and their rumen produced excess volatile fatty acids resulting in decreased palatability and feed intake.
All diets had physically effective NDF (peNDF) between 300 and 750 g/kg of NDF. The LRNS does not limit DMI based on peNDF even though it is known that particle size impacts the particle flow out of the rumen (Offer and Dixon, 2000) likely due to an increase of the time for rumination and comminution of particles, affecting the retention time, the pattern of passage (Vieira et al., 2008a, b), and consequently the intake. For high-producing dairy cows, DMI is positively related with the ratio of non-fibre carbohydrate to NDF (Zebeli et al., 2006) because of the rumen physical fill effect. A dietary peNDF above 190 to 220 g/kg NDF (Mertens, 1997; Zebeli et al., 2006) is also important to maintain the ruminal pH above 6.0 in high-producing dairy cows. Information for growing animals is scarcer than for dairy cattle, but the ruminal dynamics would be similar in the sense that larger particle size would require a longer time to escape the rumen and reduce the fill effect on voluntary intake.
Another factor that affects DMI for this type of animal is the adequate supply of ammonia-N and amino-N (i.e. a positive ruminal N balance, RNB) because it would be essential to enhance fibre fermentation and microbial growth in the rumen (Tedeschi et al., 2000). Figure 2 suggests that RNB might have been negative for study 5, which could explain the lower observed DMI compared to model expected DMI.
Even though the predictions of DMI were similar for most studies, the DMI prediction should be used as an indication only, as DMI can vary tremendously depending on environment, animal, and diet characteristics.
Average daily gain
Despite the disagreement relating to the RNB of study 4, on average across the studies these treatments had a positive RNB, but MP limited their growth. Therefore, a deficit of ruminally-undegradable protein (RUP) and/or a lack of microbial protein may have limited the performance of these animals. Even though most of these animals were not fed starch-rich diets, adding some source of starch and an adequate level of non-protein N might increase the microbial yield in the rumen (Harmon, 2009) and therefore increase the amount of microbial protein escaping the rumen. Another solution may be the addition of RUP.
There has been some indication the theoretical equation proposed by Weiss et al. (1992) may underpredict the TDN value of tropical feeds (Detmann et al., 2008). In fact, when we used the empirical equations devised by Detmann et al. (2008) for growing and finishing cattle, the ADG using the first limiting between ME and MP was 0.66 kg/d compared to the original prediction of 0.58 kg/d for level 1. Even though the mean bias decreased from 0.058 to −0.018 kg/d, precision (r2 = 0.69) and CCC (0.829) were almost identical.
Because the precision was greater for level 2 than level 1 and because we can adjust the predictions for a known MB, level 2 should be used to predict ADG of Vietnamese Yellow cattle under the feeding conditions examined in this paper, but an adjustment would have to be made. Conversely, the use of level 1 using the equations suggested by Detman et al. (2008) could also provide some insights of the animal performance without the need to use level 2. These findings are in agreement with those reported by Tedeschi et al. (2005a). In their evaluations, when MP was first limiting, the level 2 also had a greater precision than level 1 and the RMSEP was about 110 g/d for confined animals. Others have also reported acceptable predictions by the CNCPS model under confinement conditions in China (Du et al., 2010). Similarly, Zhao et al. (2008) concluded the CNCPS model was able to satisfactorily predict ADG of Chinese beef breeds with an overall MB of 0.08 (under-prediction) and RMSEP of 0.08 kg/d.
There are a number of potential reasons why ADG was on average under-predicted by the LRNS model when level 2 was used. From the supply side, Vieira et al. (1997) suggested that compartmental models, such as those discussed by Ellis et al. (1994) and Vieira et al. (2008a, b), may have a better fit for degradation of Pennisetum purpureum Schum. in the rumen using in situ technique. These compartmental models usually increase the mean retention time of particulate matter in the rumen compared to the exponential model used by the LRNS to obtain the kd. Therefore, it is possible the kd of tropical feeds may be slower than used in our simulations. If a slower kd is used, it is possible the amount of energy from the feed would increase. Concurrently, from the requirement side, energy required for maintenance might have been overestimated for these animals or they could have a greater efficiency of use of ME for maintenance likely due to compensatory growth (Tedeschi et al., 2010). Even though physical activity can account for as much as 20% (Tedeschi et al., 2004) of maintenance energy expenditure, it seems these animals have minimal requirements for physical activity.
CONCLUSIONS
Under specific circumstances when the kd of the carbohydrate and protein fractions needed by level 2 of the LRNS are not known, the LRNS level 1 solution may be an alternative to predict animal performance. However, given the results of our evaluation in which the kd were assumed to be those listed in the feed library (Tedeschi et al., 2002), the LRNS level 2 predictions of ADG were satisfactory and better than those of level 1. Even though our analyses indicated the LRNS might be able to predict ADG when DMI is known, few studies under Vietnamese conditions that had enough information to perform the simulations we used. Therefore, a more comprehensive evaluation is suggested.
ACKNOWLEDGEMENTS
We would like to thank the staff and students who were involved in the feeding trials used for this study. This study was funded by the Australian Centre for International Agricultural Research (ACIAR), and the feeding trials used for the analyses were funded by ACIAR and the Norwegian Programme for Development, Research and Education (NUFU).
