Differential Proteome Analysis of Breast and Thigh Muscles between Korean Native Chickens and Commercial Broilers
Article information
Abstract
The Korean native chickens (Woorimotdak™, KNC) and commercial broilers (Ross, CB) show obvious differences in meat flavor after cooking. To understand the contribution of protein and peptide for meat flavor, 2-dimensional (2-D) gel electrophoresis and matrix-assisted laser desorption-ionization time-of-flight (MALDI-TOF) mass spectrometry was performed. A total of 16 protein spots were differentially expressed in the breast and thigh meat between the two breeds. A total of seven protein spots were represented by different levels between KNC and CB for breast meat. Among them three protein spots (TU39149, TU40162 and TU39598) showed increases in their expressions in KNC while other four protein spots (BU40125, BU40119, BU40029 and BU39904) showed increases in CB. All nine protein spots that were represented by different levels between KNC and CB for thigh meat showed increases in their expression in KNC. Phosphoglucomutase 1 (PGM 1), myosin heavy chain (MyHC), heat shock protein B1 (HSP27), cytochrome c reductase (Enzyme Q), Glyoxylase 1, DNA methyltransferase 3B (DNA MTase 3) were identified as the main protein spots by MALDI-TOF mass spectrometry. These results can provide valuable basic information for understanding the molecular mechanism responsible for breed specific differences in meat quality, especially the meat flavour.
INTRODUCTION
Due to relatively low fat and cholesterol contents, chicken meat is well-recognized as a healthy animal food compared to other meat (Jaturasitha et al., 2008). In addition, chicken meat is relatively lower in price, has easy to handle portions and is not the subject of religious restrictions as far as its consumption is concerned (Jaturasitha, 2004). The per capita chicken meat consumption has increased by approximately five folds during the last four decades in Korea, and the trend was similarly observed in Asian countries including China (Han et al., 2009). Most of chicken meat consumed in Korea and other countries are from a few commercialized broiler strains which grow rapidly in intensive fattening systems (Jaturasitha et al., 2008).
Recently in Korea, there has been an increasing interest in consumers for Korean native chicken (KNC) meat (Sang et al., 2006). The KNC meat contains less fat and higher protein than that from commercial broilers (CB), which is attractive enough to consumers to pay a two to three times higher price than the CB meat (Kong et al., 2006). Moreover, KNC meat has better taste, color, and flavor compared to the CB meat. The KNC meat is usually darker and redder and contains more essential fatty acids, total collagen (Jeon et al., 2010), and better sensory characteristics than that of CB (Choe et al., 2010). Ahn and Park (2002) have reported that large quantities of desirable amino acids and nucleic acids were detected in KNC. Jung et al. (2011) have confirmed that inosine-5′-monophosphate (IMP) content was higher in KNC than in CB.
The flavor of muscle foods is dependent upon factors such as the animal’s age, breed, sex, nutritional status and manner of cooking (Spanier et al., 1997). Most important factor for the final flavor of the meat is known to the postmortem aging process as many chemical flavor components such as sugar, organic acid, peptides, free amino acid, and metabolites of adenine nucleotide metabolism which is due to hydrolytic activity are formed during this time. These components serve either directly as flavor components or as a pool of reactive flavors and intermediates that form many of the characteristic meat flavors after cooking (Spanier et al., 1997). Though the majority of meat flavor is lipid in origin, peptides and amino acids also play a vital role in overall meat flavor. Amino acids and peptide levels have been shown to change with postmortem aging in muscle (Spanier et al., 2004). Sentandreu et al. (2007) also indicated that the large polypeptides serve as substrates for the action of other muscle enzymes such as different groups of exopeptidases. The consequence is an important accumulation of small size free amino acids and peptides, which contributes to meat flavor characteristic. However only few studies have been conducted to show that food taste is affected by longer peptide or proteinaceous materials.
The proteome analysis based on 2-dimensional (2-D) gel electrophoresis and matrix-assisted laser desorption-ionization time-of-flight (MALDI-TOF) mass spectrometry is a method of choice for the quantitative differential display of large numbers of proteins, and is a promising and powerful tool in meat science. In the present study, we performed proteomic analysis to characterize and compare protein expression profiles in the breast and thigh meat of two chicken breeds, KNC and CB. Our aim was to reveal the differences of breed-related proteins expression between KNC and CB, because it might be useful to understand the molecular mechanisms responsible for breed specific differences in meat quality, especially meat flavor characteristic.
MATERIALS AND METHODS
Animal and experimental design
Two-hundred 1-d-old, mixed-sex Korean native chicken (Woorimotdak™, KNC) along with 200 commercial broilers (Ross, CB) were obtained from a commercial hatchery. Chickens were randomly assigned to floor pens (20 birds per pen, 3.0 m×2.0 m) under the standard conditions of temperature, humidity, and ventilation, as well as 24 h fluorescent lighting for the entire experimental period. Chickens had ad libitum access to water and were fed a commercial broiler starter (0 to 6 d), grower (7 to 21 d) and finisher (21 to 35 d for CB and 77 days for KNC) diets. The diet was a typical commercial feed produced for broilers (Chunhajeil Feed Co., Daejeon, Korea) and contained approximately 20% crude protein, 4% crude fiber and 3,100 ME kcal/kg. The chickens were killed by conventional neck cut, bled for 2 min, feathers removed, and eviscerated. The breast (pectoralis) and thigh (biceps fermoris) muscles were dissected from the carcasses after chilling at 4°C for 24 h. Then, they were deboned and the visible skin, fat and connective tissues were removed. Meat samples from 10 birds per breed (total of 40 samples with breasts and thighs) were vacuum-packed and then stored in a freezer at −50°C until further analysis.
Extraction of solubilized proteins from breast and thigh meat of Korean native chicken and commercial broilers for 2-dimensional analysis
For 2-D PAGE, soluble proteins were extracted as described by Han et al. (2007). Sodium dodecyl sulfate (SDS), phenylmethanesulfonyl fluoride (PMSF), urea, thiourea, 3-[(3-cholamidopropyl) dimethylammonio]-1-propanesul-fonate (CHAPS), dithiothreitol (DTT), isopropanol, Tris-HCI, NH4HCO3, a-ciano-hydroxycinnamic acid, tributylphosphine (TBP), thifluoroacetic acid (TFA), and trypsin were obtained from Sigma Co. (St. Louis, MO, USA). Acrylamide was obtained from Amresco (Solon, Ohio, USA). An equal volume of lysis buffer A containing 1% SDS, 1 mM PMSF, protease inhibitor cocktail (Roche, Indianapolis, IN, USA), 100 mM Tris-HCl, (pH 7.0) for pH 3 to 10 was added to the meat samples. Samples were sonicated for 5 s and placed in chilled ice water, and then mixed with an equal volume of lysis buffer B (7 M urea, 2 M thiourea, 4% CHAPS, 0.1 M DTT, 1 mM PMSF, protease inhibitor 40 mM Tris-HCl, pH 7.0). The samples were shaken gently for 1 h at room temperature, and then centrifuged at 15,000×g for 20 min. The solubilized protein extracts were quantified by Bradford protein assay (Bio-Rad, Hercules, CA, USA).
2-Dimensional gel electrophoresis
Precast 18 cm IPG strips (dry polyacrylamide gel strip with an immobilized pH gradient) with pH 3 to 10 range were obtained from Amersham Biosciences (Piscataway, NJ, USA). Preparative meat protein sample (1 mg) was used for isoelectric focusing (IEF). The sample was mixed with modified rehydration buffer (7 M urea, 2 M thiourea, 4% CHAPS, 2.5% DTT, 10% isopropanol, 5% glycerol, 2% v/v IPG buffer pH 3 to 10) to total volume of 350 μl. A mixture of samples was loaded onto an IPG strips (pH 3 to 10; 180 ×3×0.5 mm). The strip was allowed to rehydrate overnight in swelling tray. After rehydration, first dimension, IEF, was performed using an Amersham Pharmacia Multiphor II IEF unit. Automatic isoelectric focusing was carried out for with 1.5×10⁵ Vh. Voltage was started at 100 V and gradually increased to a final voltage of 8000 V. After the first dimensional IEF, IPG gel strip were placed in an equilibration solution (6 M urea, 2% SDS, 50% v/v glycerol, 2.5% acrylamide, 1.5 M Tris-HCl, pH 8.8) containing 5 mM TBP for 20 min with gentle shaking. The second dimensional separation was performed on 8 to 16% linear gradient SDS polyacrylamide gels. The gels were placed into an ISO-DALT system (Hoefer Scientific Instruments, San Francisco, CA, USA). The gels (200×250×1.0 mm) were run overnight at 10 to 15 mA per gel until the bromophenol blue marker dye (Amersham Biosciences, Piscataway, NJ, USA) had disappeared at the bottom of the gel.
Staining and image analysis of 2-dimensional gels
After 2-D gel electrophoresis, gels were stained with colloidal coomassie brilliant blue G-250 (CBB, Amersham Biosciences, Piscataway, NJ, USA). The gels were fixed for 1 h in fixation solution (30% v/v methanol, 10% v/v acetic acid) and stained with colloidal CBB G250 for 24 h, and then destained with 1% acetic acid. The gels were analyzed by Melanie III software (Swiss Institute for Bioinformatics, Geneva, Switzerland). The calculations were applied to the percent volume parameter representative of the protein expression. Variations in abundance were calculated as the ratio of average values (% vol) between the two classes. The process for validation of variant proteins was carried out by human operators.
Sample preparation for matrix-assisted laser desorption-ionization time-of-flight mass spectrometry analysis
For analysis of coomassie-stained proteins, the pieces of gel slab were destained by 120 μl wash solution (50% v/v acetonitrile, 25 mM NH4HCO3, pH 7.8). The washed gel pieces were dehydrated with 50 μl of acetonitrile, and then dried for 30 min with a vacuum centrifuge. The dried gel pieces were rehydrated with 5 μl of trypsin solution (trypsin at a concentration of 0.0012 μg/μl in 25 mM NH4HCO3, pH 7.8). The gel pieces were completely covered with additional ammonium bicarbonate buffer if needed, and then placed at 37°C overnight. The supernatants were discarded when digestion was completed. The gel pieces were added with extraction buffer (50% acetonitrile/0.5% TFA), and then sonication was applied for 30 min to extract residual peptides. The extracted peptides were used for MALDI-TOF analysis. Mass spectrometric analysis of peptide mass fingerprinting (PMF) was performed using a Voyager-DE STR MALDI-TOF-MS (Perseptive Biosystems, Framingham, MA, USA). The extracted peptide solution (1 μl) was mixed with the same volume of matrix solution (10 mg/ml α-ciano-4-hydroxicinnamic acid, 0.1% v/v TFA, and 50% v/v acetonitrile), loaded onto a MALDI sample plate (96 well) and crystallized. For each sample, average 500 spectra were obtained and scans were performed twice. Spectra were calibrated upon acquisition automatically using an external 3-point calibration. Peak assignment was performed manually using Data Explorer™ software that is part of the Voyager-DE STR MALDI-TOF-MS software package (Perseptive Biosystems, Framingham, MA, USA) and spectra were saved as peak table files (*. pkt) to search against non-redundant protein sequence database on SWISS-PROT and/or NCBInr (2008/10/01, Data Bank).
Statistical analysis
One way ANOVA was performed by using SAS software (SAS, 2002) and when the significance was found, Student-Newman-Keuls’ multiple range tests was carried out to differentiate among the mean values at p<0.05 level.
RESULTS AND DISCUSSION
Different separation patterns of breast and thigh meat proteins from KNC and CB were observed using 2-D electrophoresis images, respectively (Figures 1 and 4). The expression levels of variant protein spots were statistically analyzed and represented by the mean of % volume histograms and the differently expressed protein spots for breast and thigh meat were shown in Figure 2, 3, 5 and 6. Totally seven protein spots were represented by different levels between KNC and CB for the breast meat. Among them three protein spots (TU39149, TU40162 and TU39598) showed increase in their expressions in KNC (Figures 2 and 3) while other four protein spots (BU40125, BU40119, BU40029 and BU39904) showed increase in CB. All nine protein spots that were represented by different levels between KNC and CB for thigh meat showed increase in their expressions in KNC compared to CB (Figures 5 and 6).

2-D PAGE protein separation of breast meat from Korean native chickens (A) and commercial broilers (B), as visualized by coomassie brilliant blue staining. The first dimension was in 18 cm IPG with pH 3 to 10 range, and the second dimension was in an 8 to 16% gradient polyacrylamide gel. Arrows show protein spots that were quantitatively different between the two breeds.

2-D PAGE protein separation of thigh meat from Korean native chickens (A) and broilers (B), as visualized by coomassie brilliant blue staining. The first dimension was in 18 cm IPG with pH 3 to 10 range, and the second dimension was in an 8 to 16% gradient polyacrylamide gel. Arrows show protein spots that were quantitatively different between the two breeds.
Differentially expressed protein spots by the mean of % volume histograms of breast meat proteins from Korean native chickens and broilers (a to c: Korean native chickens; d to f: broilers).
Differentially expressed protein spots of breast meat, between Korean native chickens (KNC) and broilers (CB). A solid lined-circle represents up-regulation and dotted line represents down-regulation.
Differentially expressed protein spots in thigh meat, between Korean native chickens (KNC) and broilers (CB). A solid line represents up-regulation and dotted line represents down-regulation.
Differentially expressed protein spots by the mean of % volume histograms of thigh meat proteins from Korean native chickens and broilers (a to c: Korean native chickens; d to f: broilers).
The differently expressed spots were excised from gels and identified after tryptic digestion by MALDI-TOF mass spectrometry. Appeared spots were identified as the known protein from SWISS-PROT and NCBInr database searching. The search results were evaluated based on the source of accepted standard that takes into account the number of peptides matched to the candidate protein, the coverage of the candidate protein’s sequence by the matching peptide and agreement of the experimental and theoretical isoelectric point (pI) and molecular weight. The identified proteins of breast meat and thigh meat of KNC and CB were presented in Table 1 and 2, respectively. The spots TU39149 and TU2369 had high expressions in the breast and thigh meat of KNC when compared with CB. They were identified as the same protein phosphoglucomutase 1 (PGM 1). The PGM1 enzyme catalyzes the interconversion of glucose-1-phosphate and glucose-6-phosphate, whose activity is increased by phosphorylation and reduced in oxidative fibers of skeletal muscle (Hemmer et al., 1993). The increasing of PGM1 might indicate that KNC had apparently relied more on glycolytic metabolism and implying high glycogen level (Xu et al., 2009). The Increase of glycolytic metabolism was associated with up-regulation of HSP27. Previous proteome studies demonstrated that HSP27 protein increased in glycolytic-type muscle fibers in ovine and swine muscle (Hamelin et al., 2006; Hamelin et al., 2007; Kim et al., 2007). Therefore, it cannot be concluded that KNC has more relied on glycolytic metabolism in the present study and a further study is necessary. The spot TU40162 was highly expressed in KNC breast meat and it was identified as mysosin heavy chain (MyHC) fragment. The difference in the presence of MyHC was probably related to degradation of different muscle fiber type during postmortem aging period in different chicken breeds. Breed accounts for most of the genetic factors affecting the muscle fiber composition. Previous reports had discussed the relationship among muscle fiber type, pig breed, and meat quality (Kim et al., 2008). Previous research have shown that the distribution of type II fibers was different in breeds through MyCH composition analysis by immunohistochemistry, qRT-PCR or semi-quantitative RT-PCR, and indicated that the MyHC composition at mRNA level was agreed with protein level (Lefaucheur et al., 2004; Wimmers et al., 2008). Xu et al. (2009) reported that type IIb fiber was highly expressed in the improved swine breed compare to the domestic pig breed used in their study. However, type I, IIa and IIx expression was greater in the domestic pig breed. The percentage of MyHC IIb contributed to increase in muscle mass, whereas the presence of oxidative fibers (type I and IIa fibers) was positively related to the color characteristics, better water-holding capacity and better tenderness of meat (Wimmers et al., 2008). The BU40119 and BU40029 were highly expressed in breast meat of CB, and they were identified as sarcalumenin (SRL) protein and ATP synthase subunit beta (ATPase-β) respectively. The SRL protein, especially expressed in striated muscle cells, is a Ca2+-binding protein localized in sarcoplasmic reticulum (SR) of the intracellular Ca2+ store, showed slow relation phases after contraction (Yoshida et al., 2005). The different expression of SRL probably related to rigor mortis of phenomenon of different muscle fiber types. The ATPase-β, which is an oxidative metabolism-related protein, is the catalytic part of the ATP synthase complex and catalyzes the rate-limiting step of ATP formation in eukaryotic cells (Izquierdo et al., 2006). The higher expression of ATPase-β of CB was indicated that CB has greater oxidative capacity than that of KNC. This can be mainly due to lower HSP27 level in CB which decreases in glycolytic-type muscle fibers and increases in oxidative-type muscle fibers (Hamelin et al., 2006; Hamelin et al., 2007; Kim et al., 2007) Previous research indicated that ATPase-β has an important role in muscle growth and fat contents (Xu et al., 2009). The TU2056 was identified as heat shock protein B1 (HSP27), and it was greater expressed in KNC thigh. HSP was called stress proteins that play a universal physiological role in maintaining cellular homeostasis. HSP27 shows abundant constitutive expression in skeletal muscle and plays a key role in organizing and protecting the myofibril structure (Sugiyama et al., 2000). A previous study demonstrated that HSP27 increased in glycolytic type muscle fibers of ovine and swine (Kim et al., 2007). The greater expression of HSP27 in KNC thigh meat indicated that different breeds showed different patterns in glycolytic metabolism and postnatal muscle growth. Hollung et al. (2009) also observed that HSP27 was differently expressed in three pig breeds. TU2822 was up regulated in KNC and identified as Troponin T fragment. Troponin T is a structural protein in muscle and strong correlations have been founded between postmortem degradation of Troponin T and shear force. In raw and cooked thigh meat, KNC was showed higher hardness than that of CB (Choe et al., 2010). The spot TU2258, 2310, and 2301 were also highly expressed in KNC thigh meat, and were identified as cytochrome c reductase (Enzyme Q), glyoxylase 1, and DNA methyltransferase 3B (DNA MTase 3) respectively. The Enzyme Q belongs to the family of oxidoreductases, playing a critical role in biochemical generation of ATP oxidative phosphorylation (Gao et al., 2003). The glyoxylase 1 was involved in glyoxlase system, DNA MTase 3 was a family of DNA methyltransferases. Beside these proteins, few uncharacterized proteins and peptides such as TU39598, TU1395, TU2829, BU40125, and BU39904 were also identified. In previous studies, the proteomes of porcine muscle showed different expression of proteins such as structural protein, metabolism protein, myofibrillar regulatory protein, and defense and stress protein in two pig breed. Moreover, these proteins were associated with muscle growth and meat quality (Xu et al., 2009).
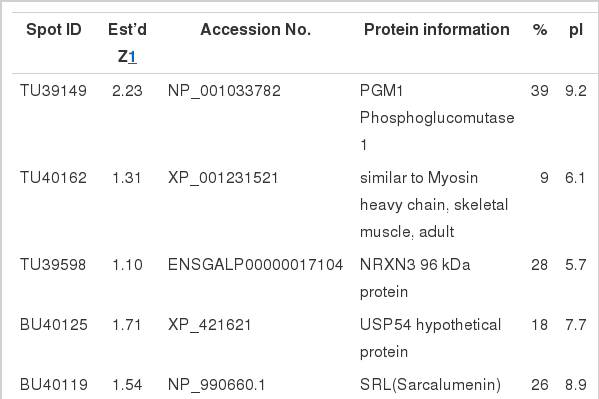
Up expressed breast meat proteins of Korean native chickens and broilers identified by 2-DE analysis and matrix-assisted laser desorption-ionization time-of-flight (MALDI-TOF)

Up expressed thigh meat proteins of Korean native chickens identified by 2-DE analysis and matrix-assisted laser desorption-ionization time-of-flight (MALDI-TOF)
In conclusion, many known and uncharacterized proteins were differentially expressed from breast and thigh meat of KNC compare to CB using 2-D gel electrophoresis and MALDI-TOF mass spectrometry analysis. These proteins were almost attributed degradation of muscle protein during postmortem aging period. These results provide valuable information for understanding the molecular mechanisms responsible for breed-specific difference in postmortem degradation of protein and meat flavor. Therefore, several unique proteins or peptides generated from KNC may probably serve as characteristic meat flavor in KNC. Further investigations are needed to evaluate that different patterns of proteins between KNC and CB meat after cooking, which are associated with meat flavor.
ACKNOWLEDGEMENT
This work was carried out with the support of “Cooperative Research Program for Agriculture Science and Technology Development (Project No. PJ90701104)”, Rural Development Administration, Republic of Korea.