Polymorphysims of CYP17-I Gene in the Exons Were Associated with the Reproductive Endocrine of Japanese Flounder (Paralichthys olivaceus)
Article information
Abstract
The cytochrome P450c17-I (CYP17-I) is one of the enzymes critical to gonadal development and the synthesis of androgens. Two single nucleotide polymorphisms (SNPs) were detected within the coding region of the CYP17-I gene in a population of 75 male Japanese flounder (Paralichthys olivaceus). They were SNP1 (c.C445T) located in exon2 and SNP2 (c.T980C (p.Phe307Leu)) located in exon5. Four physiological indices, which were serum testosterone (T), serum 17β-estradiol (E2), Hepatosomatic index (HSI), and Gonadosomatic index (GSI), were studied to examine the effect of the two SNPs on the reproductive endocrines of Japanese flounder. Multiple comparisons revealed that CT genotype of SNP1 had a much lower T level than CC genotype (p<0.05) and the GSI of individuals with CC genotype of SNP2 was higher than those with TT genotype (p<0.05). Four diplotypes were constructed based on the two SNPs and the diplotype D3 had a significantly lower T level and GSI. In conclusion, the two SNPs were significantly associated with reproductive traits of Japanese flounder.
INTRODUCTION
Single nucleotide polymorphism (SNP) is single base pair positions in genomic DNA at which different sequence alternatives (alleles) exist in normal individuals. But the least frequent allele has an abundance of 1% or greater (Brookes, 1999). SNPs are very abundant across most genomes and occur approximately one in every 225 bp in chickens and one in every 1,250 bp in humans (Liu, 2007). With the development of DNA-based marker assays and high throughput genotyping technologies, SNPs have become markers of choice for large scale mapping and genotyping (Rafalski, 2002; Liu and Cordes, 2004). SNP analysis has been widely used in human disease genetics, pharmacogenetics, and animal breeding (Liao and Lee, 2010). Furthermore, SNP markers have also been used to screen functional genes in a number of aquatic species, including Japanese flounder (He et al., 2011), rainbow trout (Cecilia et al., 2009), goldfish (Chang et al., 2009), giant freshwater prawn (Thanh et al., 2010), giant tiger shrimp (Sirikan et al., 2010), common carp (Pawapol et al., 2010) and gilthead seabream (Carmen et al., 2011). Single-strand conformation polymorphism (SSCP) is useful as a diagnostic tool for examining genetic diversity due to SNPs in various species owing to its convenience and cost effectiveness (Orita et al., 1989).
Cytochrome P450c17 (17α-hydroxylase/C17–20 lyase, CYP17) is essential for the production of 17α-hydroxylated progestins in gonadal tissues and cortisol in adrenal tissues (Kazeto et al., 2000). Fish have two types of p450c17s, P450c17-I and P450c17-II. They are encoded by CYP17-I and CYP17-II genes, respectively. CYP17-I gene encodes an enzyme with both 17α-hydroxylase and 17, 20-lyase activities. 17α-hydroxylase is responsible for hydroxylating pregnenolone and progesterone to their 17α-OH derivatives, and then converted by 17, 20-lyase to dehydroepiandrosterone and androstenedione and subsequently to testosterone and estrogens (Nakajin et al., 1981; Payne, 1990; Conley and Bird, 1997). The polymorphisms of the CYP17 gene were extensively studied using SNPs in both human beings and animals.
However, there has been no report about SNPs of CYP17-I gene in fish until now. The purpose of this study was to investigate the SNPs of Japanese flounder CYP17-I gene which had been obtained (Genbank ID: FJ815204) and then analyze the effects of these SNPs on the reproductive endocrines. Four physiological indices were used to measure these effects. They were serum testosterone (T), serum 17β-estradiol (E2), Hepatosomatic index (HSI) and Gonadosomatic index (GSI).
MATERIALS AND METHODS
Experimental fish
All the experimental fish (six months) used in the present experiment were provided by the Shandong Kehe High Technology Co., Ltd. Fish were reared in natural sea water under the controlled conditions (20±0.5°C; ≥4 mg/L O2; 14:10 h light:dark cycle). One hundred male Japanese flounder were sampled randomly and then anesthetized before the experiment. Blood was extracted from the fish tail with disposable syringes, and then stored at 4°C. During the sampling process, four measurements were recorded including their wet weights, body lengths and the weights of gonad and liver. Muscle samples were separated and then stored at −80°C.
Primer design, DNA extraction and polymerase chain reaction (PCR)
Primers were designed using Oligo 6.0 software. Seven primer sets were designed for the CYP17-I gene of Japanese flounder based on the 8 exons (Table 1). The primers of exon 4 were not designed because its sequence was less than 100 base pairs (bp).

Primer sequences and information of Japanese flounder CYP17-I gene
Total DNA was extracted from the frozen muscle samples using the phenolchloroform method. The DNA purity and concentration were measured using an UV spectrotometer (Amersham, American). There were 75 samples suitable for use in the SSCP analysis.
The PCR reaction was performed in a volume of 25 μl containing of 2.5 μl of 10×PCR Buffer, 80 ng of genomic DNA, 0.20 mM each dNTP, 0.50 mM each primer and 0.25 U Taq DNA polymerase (rTaq TaKaRa). The cycling conditions were carried out with an initial denaturation step for 5 min at 94°C, followed by 35 cycles consisting of three steps: 94°C for 30 s, 59 to 63°C for 30 s, 72°C for 30 s. A final extension was performed at 72°C for 10 min.
Single-stranded conformation polymorphism (SSCP) analysis and sequencing
The amplification product was analyzed by SSCP (He et al., 2008). Five μl PCR products from each individual were mixed with 8 μl denaturing buffer (98% formamide, 0.09% xylene cyanole FF, and 0.09% bromophenol blue). Each mixture was heat-denatured at 98°C for 10 min and then immediately chilled on ice for 10 min. The denatured products of CYP17-I gene were electrophoretically analyzed (10% PAGE; 29:1 crosslink) at 120 V for 12 to 14 h at room temperature. SSCP patterns on the gels were visualized by silver staining (Qu et al., 2005). The location and chemical nature of each mutation was confirmed by sequencing of the re-amplified product.
Hepatosomatic index (HSI) and Gonadosomatic index (GSI)
The Hepatosomatic index or Gonadosomatic index of each animal was calculated as the following formula:
Steroid radioimmunoassay (RIA)
Blood samples stored at 4°C for 8 h were centrifugated at 12,000 g for 10 min. The serum was transferred into 1.5-ml plastic microfuge tubes and then stored at −40°C. The serum testosterone and estradiol-17β were quantified by 125I radioimmunoassay, using diagnostic kits from Diagnostic Products Corporation (Tianjin Nine Tripods Medical & Bioengineering Co., Ltd., Sino-US jointventure enterprise). The method was provided by Wen et al. (2006).
Statistical analysis
The SNP genotype of an individual at each SNP site was determined based on SSCP patterns and sequencing chromatograms. The genotype frequencies and allele frequencies for each polymorphism were calculated by Microsoft Excel. ANOVA tests for associations of SNP genotypes with reproductive traits (T, E2, HSI and GSI) were performed using Stat View software version 9.0 (SAS Institute Inc., Cary, NC). Significant differences among means of different genotypes were calculated using Duncan’s multiple-range test and p values no more than 0.05 were considered statistically significant.
RESULTS
Polymorphisms within exons of CYP17-I gene
The analysis of the 75 individuals by PCR-SSCP showed that primer2 and primer5 had two different migration patterns, respectively (Figure 1). After direct sequencing, we found two different alterations (Figure 2). One was a C445T transition localized at primer2 and we named it SNP1. It was a synonymous mutation which did not change the amino acid Histidine. Two genotypes were found for the SNP1 and named as CC and CT. The other alteration was a T980C transition located at primer5 and we named it SNP2. The SNP2 was a non-synonymous mutation leading to an amino acid change from Phe307 to Leu307. Two genotypes were found for the SNP2 and named as TT and CC.

Band patterns for the two SNPs. (A) Genotypes of SNP1; (B) Genotypes of SNP2.

Sequences of the two SNPs. (A) Sequence of CC genotype of SNP1 locus; (B) Sequence of CT genotype of SNP1 locus; (C) Sequence of TT genotype of SNP2 locus; (D) Sequence of CC genotype of SNP2 locus.
Frequencies of genotypes and alleles
The frequencies of genotypes and alleles of the two SNPs were showed in Table 2.
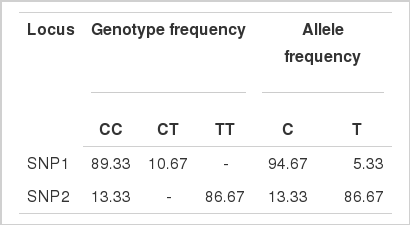
Genotypes and alleles frequencies of two SNPs of Japanese flounder CYP17-I gene (%)
The CT genotype of SNP1 and the CC genotype of SNP2 were respectively 10.67% and 13.33% which were obviously lower than the other genotypes. In addition, the two SNPs were both bi-allelic, each SNP site varied between only two nucleotides.
SNPs and reproductive traits association analysis
GLM estimation was performed to analyze the associations of SNPs in CYP17-I gene with reproductive traits (Table 3). The results showed that SNP1 was significantly associated with T level (p<0.05) while SNP2 had significantly associations with GSI (p<0.05). Multiple comparisons (Table 4) revealed that the individuals with CT genotype had a much lower T level than those with CC genotype in SNP1 (p<0.05). GSI of individuals with CC genotype in SNP2 was higher than the TT genotype individuals (p<0.05).

Associations between each of the SNPs of Japanese flounder and reproductive traits
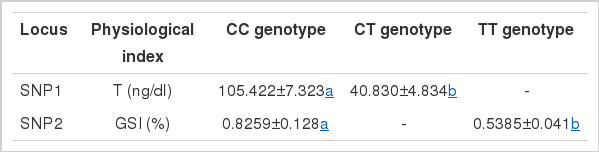
Multiple comparisons of reproductive traits among different genotypes of two SNPs locus
Construction of diplotypes and the correlation between diplotypes and the reproductive traits
Four diplotypes were constructed and Table 5 shows the associations between diplotypes and the reproduction traits. The results indicated that there was a significant association between diplotypes and T level and GSI (p<0.05). The T level of diplotype D3 and D4 was lower than other diplotypes. What’s more, the GSI of diplotypes D1 and D3 was lower than diplotypes D2 and D4. It is clear that D3 had both lower T level and GSI than other diplotypes.
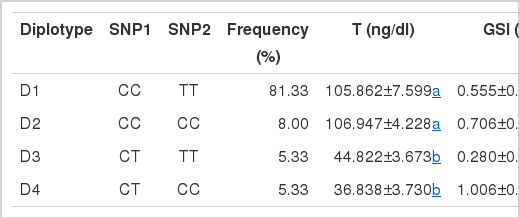
Diplotypes frequencies of CYP17-I gene and associations with reproductive traits in Japanese flounder
DISCUSSIONS
Our study is the first to report the SNPs of CYP17-I gene in Japanese flounder. What we have established in this work were associations between SNPs of CYP17-I gene and the four reproduction traits (T, E2, GSI, HSI). P450 17α-hydroxylase, 17, 20-lyase (P450c17) encoded by CYP17-I gene is a key steroidogenic enzyme in the production of androgens. Androgens are essential for normal male sexual differentiation and development, and any abnormality in their production can have detrimental consequences for normal sexual development (Halm et al., 2003).
The most important result we found was that individuals with CT genotype of SNP1 had a much lower T level than those with CC genotype, although the SNP1 was a synonymous mutation. Many studies on both humans and animals have reported that a genetic polymorphism existing in the coding region or promoter region is expected to be associated with a small or moderate affect on the gene function (Weber and Nathanson, 2000). In human beings, many studies regarding single nucleotide polymorphisms of CYP17 gene have been reported. The mutation T34C located in the promoter of CYP17 gene could enhance its activity and then increase the bioavailability of testosterone and its metabolite dihydrotestosterone (Hamada et al., 2007). The T27C polymorphism in the 5′ promoter region of CYP17 gene has been implicated as a risk factor for prostate cancer (Wei et al., 2010). The mutation T1931C enhanced the transcription of the CYP17 gene and has been shown to be associated with breast cancer risk (Miyoshi et al., 2003). Several synonymous mutations have been reported to alter gene expression or protein folding (Chamary et al., 2006; Sauna et al., 2007; Gupta and Lee, 2008; Liao and Lee, 2010). So we speculate that the presence of this polymorphism may limit the activity of P450c17 and then decrease androgen production. Further studies of this type are required, specifically to test for any association between the SNP1 of the CYP17-I gene and the activity of P450c17.
A peculiar aspect of our results is the higher GSI level of the CC genotype compared to the TT genotype for the SNP2 (p<0.05). In fish, the gonads are the main organs for the expression of P450c17s. GSI indicates a difference in the gonadal developmental status. It can be concluded that the gonads of individuals with TT genotype had not developed as well as in individuals with the CC genotype. The mutation T980C may affect the gonads development. However, our study found no differences in the levels of T and E2 based on the SNP2 genotypes.
Following the recent research regarding diplotypes (He et al., 2011), we constructed four diplotypes based on the two SNPs in this study. Among the four diplotypes, D3 was significantly associated with T level and GSI (p<0.05). What’s more, D4 which was constructed by united SNP1 and SNP2 had a lower T level and higher GSI compared with D1. It provided further explanation that the two SNPs could lead to the deficiency of androgens and gonads dysplasia. So we speculate that D3 and D4 may be a promising molecular marker for marker assisted breeding.
In conclusion, two SNPs were detected and they were both associated with the reproductive endocrines of Japanese flounder. The SNP1 located in exon2 was significantly associated with serum T level (p<0.05). Individuals with CT genotype of SNP1 had a much lower T level than the CC genotype. The TT genotype of SNP2 located in exon5 had a lower GSI than the CC genotype (p<0.05). To the best of our knowledge, this is the first report on the CYP17-I gene polymorphisms in the teleosts. SNPs identified in the present study have potential applications in breeding programs. Therefore, further studies are needed at the transcriptional regulation level and protein level for deeper insights into the SNPs effects on the physiological functions of P450c17-I. In general, SNPs have high potential for applications in aquaculture.
ACKNOWLEDGEMENTS
This work was supported by Natural Science Foundation of Shandong Province, China (No. ZR2009DQ011), New Teacher Special Fund of Doctor of Ministry of Education of China (No. 20090132120006) and Postdoctoral Innovative Projects of Shandong Province, China (No.200702039).