Construction of fat1 Gene Expression Vector and Its Catalysis Efficiency in Bovine Fetal Fibroblast Cells
Article information
Abstract
The FAT-1 protein is an n-3 fatty acid desaturase, which can recognize a range of 18- and 20-carbon n-6 substrates and transform n-6 polyunsaturated fatty acids (PUFAs) into n-3 PUFAs while n-3 PUFAs have beneficial effect on human health. Fat1 gene is the coding sequence from Caenorhabditis elegans which might play an important role on lipometabolism. To reveal the function of fat1 gene in bovine fetal fibroblast cells and gain the best cell nuclear donor for transgenic bovines, the codon of fat1 sequence was optimized based on the codon usage frequency preference of bovine muscle protein, and directionally cloned into the eukaryotic expression vector pEF-GFP. After identifying by restrictive enzyme digests with AatII/XbaI and sequencing, the fusion plasmid pEF-GFP-fat1 was identified successfully. The pEF-GFP-fat1 vector was transfected into bovine fetal fibroblast cells mediated by Lipofectamine2000TM. The positive bovine fetal fibroblast cells were selected by G418 and detected by RT-PCR. The results showed that a 1,234 bp transcription was amplified by reverse transcription PCR and the positive transgenic fat1 cell line was successfully established. Then the expression level of fat1 gene in positive cells was detected using quantitative PCR, and the catalysis efficiency was detected by gas chromatography. The results demonstrated that the catalysis efficiency of fat1 was significantly high, which can improve the total PUFAs rich in EPA, DHA and DPA. Construction and expression of pEF-GFP-fat1 vector should be helpful for further understanding the mechanism of regulation of fat1 in vitro. It could also be the first step in the production of fat1 transgenic cattle.
INTRODUCTION
Fatty acids are usually unbranched and contain an even number of carbon atoms, usually from 12 to 20. Fats containing one double bond are monounstaturated and those with more than one double bond are polyunsaturated. N-3 polyunsaturated fatty acids (PUFAs) are essential components required for normal cellular function and play a particularly important role in pharmaceutical and nutraceutical fields (Lopez-Huertas, 2010). Thereamong, Arachidonic acid (AA), Eicosapentaenoic acid (EPA) and docosahexaenoic acid (DHA) play a key role in growth and development of an organism and are usually referred to as highly unsaturated fatty acids (HUFAs) (Norsker and Støttrup, 1994). A rational balanced level of n-6 and n-3 fatty acids is important, and it was found that the ideal n-6/n-3 ratio is 1:1 (Enser et al., 1996; Enser et al., 1998). Several n-3 fatty acid desaturase genes were studied in different species, like plants and algae (Meesapyodsuk et al., 2000; Pereira et al., 2004; Sakuradani et al., 2005). These studies revealed that transgenic n-3 fatty acid desaturase genes were efficient in optimizing both kinds and proportions of PUFAs in tissues. The fat1 gene from Caenorhabditis elegans (C. elegans) codes the FAT-1 protein, a 402 amino acid n-3 fatty acid desaturase which can transform C18 and C20 n-6 PUFAs into n-3 PUFAs. Supplementing n-3 PUFAs intake may be of benefit in human health. Currently, the study of fat1 gene is becoming an important topic in transgene research, and there have been many important breakthroughs. For instance, Lai et al. (2006) produced the first fat1 transgenic pig (Lai et al., 2006), which produced high levels of n-3 fatty acids from n-6 analogs, and their tissues have a significantly reduced ratio of n-6/n-3 fatty acids, but the production of the 22C n-3 PUFAs (docosapentaenoic acid, DPA and DHA) which has a higher nutritive value was still at a low level (Pan et al., 2009). A more thorough investigation of n-3 PUFAs and the effects of global climate change indicated that there would be a potential shortage of n-3 PUFAs in human diets (Kang, 2011). It is becoming clear that fat1 transgenic cattle with higher levels of n-3 PUFAs are becoming more urgent than ever. Unfortunately, many of the attempts to express fat1 in a transgenic background do not work well because of the difficulty of gene priming and expression in a different species.
We describe here the construction of a fat1 gene expression vector and its transfection in vitro and expression, which were further genetically altered for both biological safety and to follow the most efficacious method. We further studied the expression efficiency of the vector in cells with the aim of gaining the best cell nuclear donor for the production of transgenic fat1 cattle.
MATERIALS AND METHODS
Codon optimization of fat1 gene
In order to make fat1 gene with a high level of expression in bovine fetal fibroblast cells and to raise the content of the FAT-1 protein in cattle muscle, we optimized the codon of fat1 sequence from C. elegans (GenBank: NM_001028389) based on the codon usage frequency preference of bovine muscle protein without changing the amino acid sequence. We also inserted the restriction enzyme digestion sites AatII, XhoI, SmaI and XbaI to the 5′ and 3′ ends of the sequence. Coding sequences and the whole genome of bovine muscle proteins were analyzed by CHIPS of EMBOSS (the European molecular biology open software suite) (Wright, 1990; Marra et al., 2003) and codon usage of SMS (http://www.bio-soft.net/sms/index.html) (Stothard, 2000). The effective number of codons (Frank Wright Nc value) could help to judge the number of codon types. High level gene expression has a low Nc value, by contrast, a high Nc value means a low level of expression efficiency. Codon optimization of fat1 was synthesized by the Shanghai Sangon Company (Shanghai, China).
Construction of pEF-GFP-fat1 vector
The pEF-GFP plasmid (Addgene plasmid NM 11154) was a gift from Prof. Hongsheng Ouyang (Jilin University, China). Our vector, which we named pEF-GFP-fat1, contains a codon optimization fat1 cDNA driven by the EF1α promoter (elongation factor 1-alpha promoter). An enhanced green fluorescent protein (eGFP) gene was used for transient expression in cells regulated by IRES sequence, a neo-kan and amp expression cassette served as a selection marker (Figure 1). The eukaryotic expression vector pEF-GFP was double digested with XhoI and MlsI (Fermentas, Ontario, Canada) in a 10 μl reaction system: XhoI 0.75 μl, MlsI 0.75 μl, Tango buffer 2 μl, pEF-GFP plasmid 2 μl, Nuclease-free water 4.5 μl, and incubated at 37°C 5 h. Codon optimization fat1 was also double digested, with XhoI and Sma I (Fermentas, Ontario, Canada) from the pUC vector in a 10 μl reaction system: XhoI 0.75 μl, Sma I 0.75 μl, T buffer 2 μl, fat1 4 μl, Nuclease-free water 2.5 μl, 37°C 5 h. Recovered and ligated by T4 DNA Ligase (Fermentas, Ontario, Canada): T4 DNA Ligase Buffer 2.5 μl, pEF-GFP vector 2.5 μl, fat1 5 μl, T4 DNA Ligase 5 U, PEG 4000 Solution 2 μl, Nuclease-free water 12 μl and incubated at 4°C overnight. Transformed into competent E. coli (DH5α) cells (Tiangen, Beijing, China), and then prepared the pEF-GFP-fat1 plasmid.
Cell culture and cytotoxicity assay
Bovine fetal fibroblast cells were provided by the Institute of Animal Sciences, Chinese Academy of Agricultural Sciences. Cells were cultured in DMEM (Gibco, NY, USA), supplemented with 10% (v/v) fetal bovine serum (FBS; PAA, Pasching, Austria), penicillin (100 U/ml) and streptomycin (100 μg/ml) (PAA, Pasching, Austria), incubated at 37°C, 5% CO2. In a typical cytotoxicity assay, all the adherent cells were digested by 0.25% trypsin and seeded in 6-well plates with a density of 2×10⁵ per well and when the cell confluence reached 70 to 80%, cells were cultured in selection DMEM containing 300, 400, 500, 600, 700 and 800 μg/ml of G418 antibiotic (Invitrogen, CA, USA). After incubation for 72 h in a fresh selection DMEM the cell proliferation ability was observed for 15 d. The tests were performed in triplicate, the best G418 screening concentration was after 10 to 14 d the cells survival rate was 0% after adding G418, the lowest concentration of G418.
Transfection of bovine fetal fibroblast cells
The vector construction and production of transgenic bovine fetal fibroblast cells that conditionally express the gene for enhanced green fluorescent protein (eGFP) were performed as described previously, cells were transfected using Lipofectamine2000TM reagent (Invitrogen, CA, USA) according to the manufacturer’s protocol. DNA complexes (in a total volume of 500 μl) were prepared as follows: 4 μl pEF-GFP-fat1 vector was diluted in appropriate 250 μl of DMEM Reduced Serum Medium, mixed gently, then 6 μl Lipofectamine2000TM was added to 250 μl DMEM Reduced Serum Medium, respectively, mixed gently and incubated for 30 min at room temperature to allow the formation of transfection complexes. All the cells were seeded in 6-well plates and when the cell confluence reached 90 to 95%, transfection experiments were performed. The cells were washed with DMEM 3 times without FBS and penicillin-streptomycin, and then 1.5 ml DMEM Reduced Serum Medium was added to each well, the 500 μl transfection complexes were then added to each well and the plate was rocked back and forth gently. After an incubation of 3.5 h at 37°C under 5% CO2, the medium was changed with 2 ml fresh Growth DMEM containing 10% FBS. Starting 48 h later, cells were propagated and split into selection DMEM. Change the selection DMEM containing 500 μg/ml of G418 antibiotic for an additional 12 days. The surviving cell colonies were picked and propagated in a new plate until stable cell line formation. A control experimental group just with pEF-GFP vector/water was performed under the same conditions.
Reverse transcription PCR proved transgenic positive cells
Expression of bovine fat1 mRNA in bovine fetal fibroblast cells was determined by reverse transcription (RT) PCR. On d 12, cells were collected and pelleted together along with any cells floating in the culture, total RNA was extracted from positive cells and cDNA was prepared using Oligo dT. The positive cells cDNA acted as a template for specificity primers used to amplify the fat1 coding region sequence, GAPDH primers were used as a control. Primers used in RT-PCR reactions were as follows: fat1 sense primer 5′-ACTTCTAGAGCCACCATGGTCGC TCATTCC-3′, and antisense primer 5′-ACTGCTAGCTTA CTTGGCCTTTGCCTTCT-3′. PCR was performed in a 25 μl reaction system with 35 cycles: 94°C for 30 s, 66°C for 30 s, and 72°C for 60 s. The PCR products were subjected to electrophoresis on 1.5% agarose gel.
qPCR assessment expression of fat1 gene
We used the Eppendorf Mastercycler ep realplex System, relative quantification and SYBR GreenI Reagents (BIOER, Hangzhou, China) for the quantitative analysis of fat1 gene mRNA expression in cells as well as the GAPDH primer as a control. The conditions used for real-time quantitative PCR (qPCR) were 2 min at 95°C and then 35 cycles of 15 s at 95°C and 40 s at 60°C. The pEF-GFP vector group and untransfection groups were negative controls.
GC analysis catalysis efficiency
Gas chromatograph (GC) was used to analyze the catalysis efficiency of the pEF-GFP-fat1 vector. Polyclone was mixed in order to eliminate the effects of the inserted gene integration site. Lipids were extracted as in a previous report (Kang and Wang, 2005; Lai et al., 2006; Lu et al., 2008). Briefly, the cell pellet was collected in a glass methylation tube, mixed with 4.0 ml MeOH and 2.0 ml trichlormethane (capillary GC; Sigma-Aldrich, MO, USA), 1.5 ml ddH2O, and placed in a rotating platform shaker for 10 s then left at room temperature for 15 min. Trichlormethane and ddH2O were added to the wells and mixed again, left at room temperature for 5 min. The mixture was centrifuged at 1,500 g/min for 30 min then cooled to 16°C, removed the upper layer and dried under nitrogen. Then 1.5 ml of 14% BF3/MeOH reagent was added and mixed vigorously. The mixture was heated at 90°C for 30 min, cooled to room temperature and 4.0 ml of hexane were added, and methyl esters extracted in the hexane phase following addition of 1.5 ml ddH2O. The samples were centrifuged for 1 min, and then the upper hexane layer was removed and concentrated under nitrogen.
Fatty acid methyl esters were analyzed by gas chromatography using a fully automated HP5890 system (Agilent) equipped with a flame-ionization detector. GC conditions: column SP-2560 (Supelco) 100 m×0.25 mm ×0.20 μm. Oven 140°C for 5 min, 10°C/min to 220°C, hold 50 min. Injector/Detector 260°C carrier gas helium at about 5 psi. Identification of components was done by comparison of retention times with those of authentic standards (Sigma-Aldrich, MO, USA).
The cell cycle change before and after transfection was analyzed using Flow CytoMeter, Propidium Iodide approach (PI) according to the manufacturer’s protocol (Lecoeur, 2002).
Statistical analysis
All paired comparisons were subjected to two tailed Student t test with p<0.05 considered statistically significant.
RESULTS
Codon optimization of fat1 gene
We changed 65 bases, which concerned 65 codons and 7 amino acids. The change accounted for 5.38% of all the fat1 gene bases. The G+C content increased from 45.08% to 50.04% and were distributed uniformly, which was beneficial for the expression of the gene. The prediction result of the RNA secondary structure showed that the optimized gene could have high level expression in cattle muscle. The CHIPS programs were used calculate the Frank Wright Nc value of Bovine muscle protein and fat1, the result showed that there was a decreasing of Frank Wright Nc value after optimization, from 41.598 to 34.588 specifically (Table 1).
Identification of pEF-GFP-fat1 vector
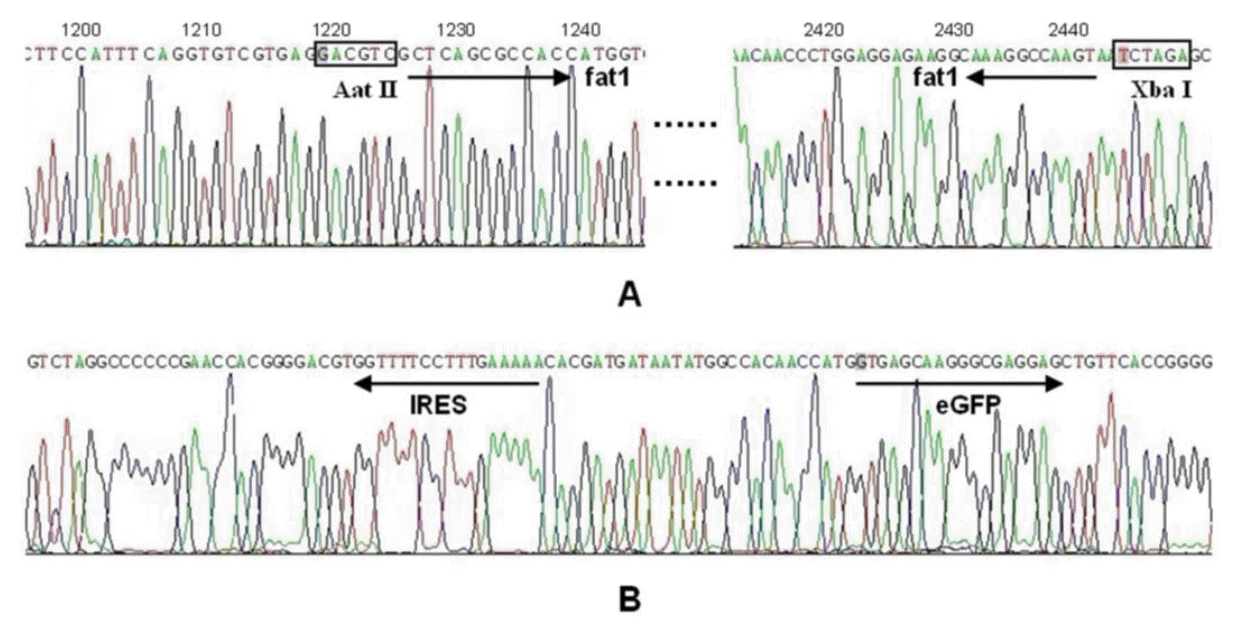
The pEF-GFP-fat1 vector was identified by restriction enzyme digestion and sequencing. The multicloning sites of AatII/XbaI were synthesized into the fat1 gene, so we used restrictive enzyme AatII/XbaI (TaKaRa, Dalian, China) to double digest, and XhoI to digest the vector. The vector was transformed and amplified in E. coli (TOP10; Tiangen, Beijing, China) according to the conventional method and extracted using AxyPrep Plasmid Miniprep Kit (Axygen, Hangzhou, China) from positive clones following the manufacturer’s instruction. The plasmids were sequenced by Beijing Genomics Institute (China), contrasted fat1 sequence by DNAStar and BLAST. The result of the digestion and sequencing showed that the vector construction was successful (Figures 2 and 3).
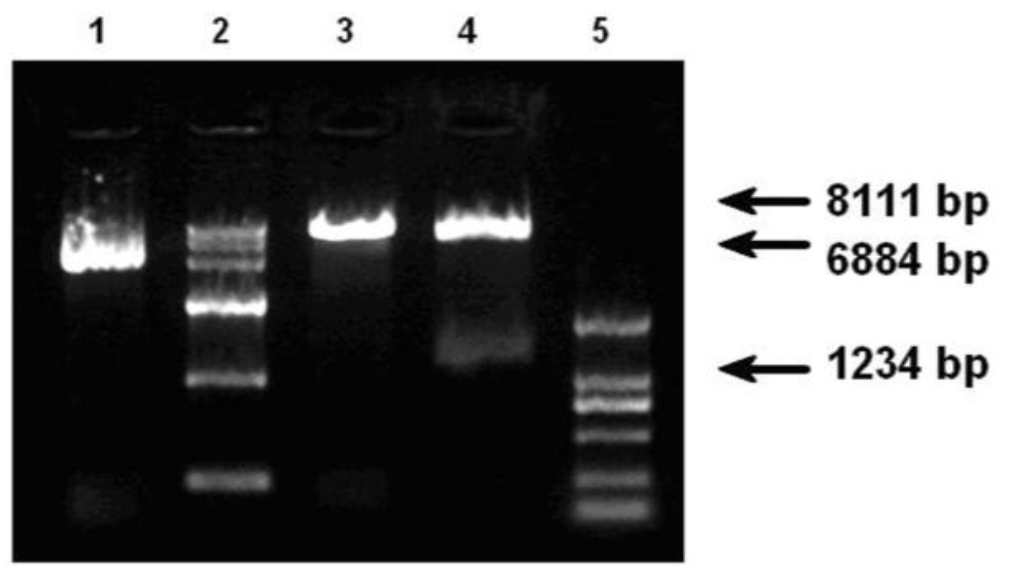
Identification of pEF-GFP-fat1 using enzyme digests. 1 : pEF-GFP-fat1 plasmid. 2 : DNA marker DL 15000. 3 : digestion by restrictive enzyme XhoI. 4 : digestion by restrictive enzyme AatII/XbaI. 5 : DNA marker DL 2000. The picture shows that fat1 gene was double digested by restrictive enzyme AatII and XbaI.
Cytotoxicity test of G418 in fetal fibroblast cells
After 3 d cytotoxicity test, each group of bovine fetal fibroblast cells began to die, and the peak time occurred at 8 to 10 d. At 12 d, the group at 500 μg/ml had a survival rate of 0%, as shown in Table 2, the best G418 selected screening concentration was 500 μg/ml.
Identification of positive cells
After transfection, the corresponding bright-field image indicated most cells were viable. However, the expression of eGFP was not evident as fluorescent cells when they were observed by fluorescent microscope following transfection after 48 h. Twelve days of G418 selection and the positive cells could be observed under visible light (Figure 4).

Compare normal cells with positive cells in morphological, under microscope (40×). A : normal cells before transfection. B : positive cell aggregate, 12 d after G418 selected. The pictures show that positive cell aggregates continue growing while others died after selected.
We have also tested the clonal fetal fibroblast cell lines by RT-PCR amplification. A 1,234 bp fragment was detected by electrophoresis on 1.5% agarose gel in the pEF-GFP-fat1 transfection group. The GAPDH control confirmed the cDNA quality (189 bp). Both the pEF-GFP vector group as the negative control and the water group as the blank control were negative as shown in Figure 5C. This showed that the transfection was successful and the exogenous gene was integrated into genome.
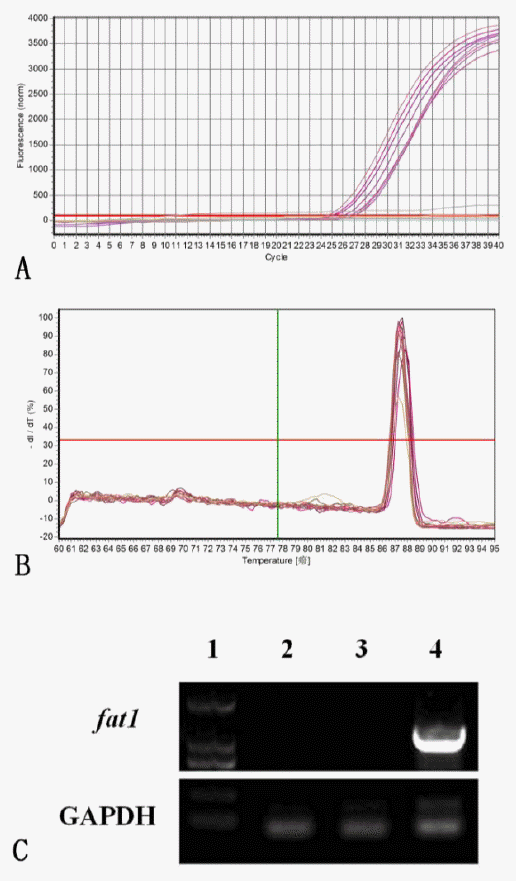
Result of RT-PCR and qPCR. A : amplification curve of qPCR, the result showed fat1 gene can be identified in positive cells. B : dissociation curve of qPCR, the result showed the quality of the reaction was precise. C : result of identification of positive cells by RT-PCR. 1 : marker. 2 : water control group. 3 : pEF-GFP vector control group. 4 : positive cells group. pEF-GFP-fat1 transfection group showed a 1,234 bp fragment. The GAPDH control confirmed the cDNA quality (189 bp), both the pEF-GFP vector group as the negative control and the water group as the blank control were negative result.
The result of qPCR indicated that the relative expression level was 35,273.37 nM in the positive fat1 group (Figure 5A and B), while there was no fat1 gene mRNA expression in pEF-GFP vector control group and Untransfection control group.
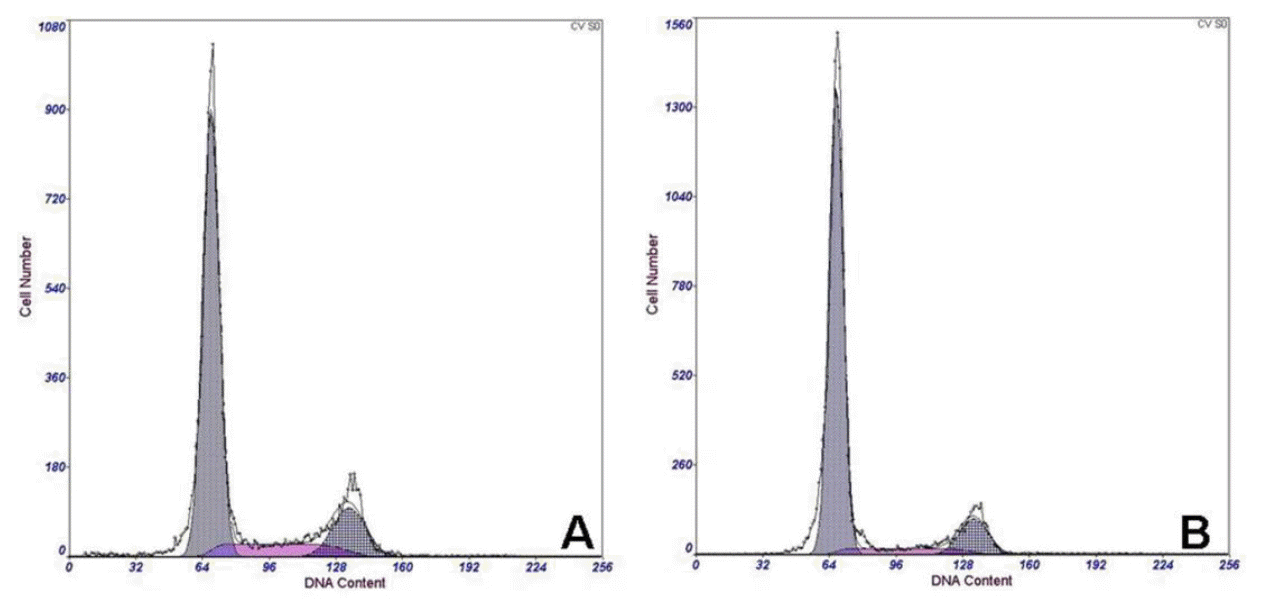
The cell cycle change was analyzed using the Propidium Iodide approach. The result showed that there was not a significant difference between pre-and post-treatment performance (Table 3, Figure 6). Consequently, the nucleus of positive cells could meet the donor condition.
Catalysis efficiency of fat1 gene
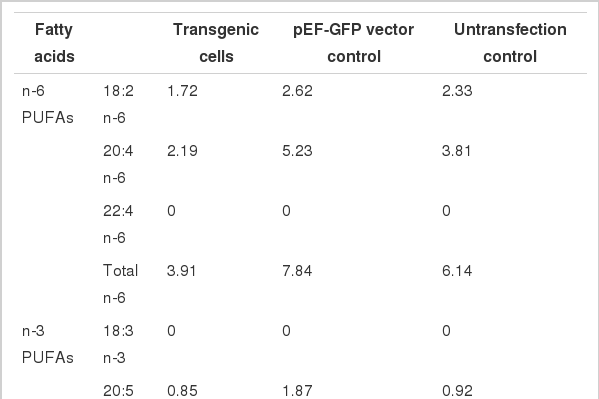
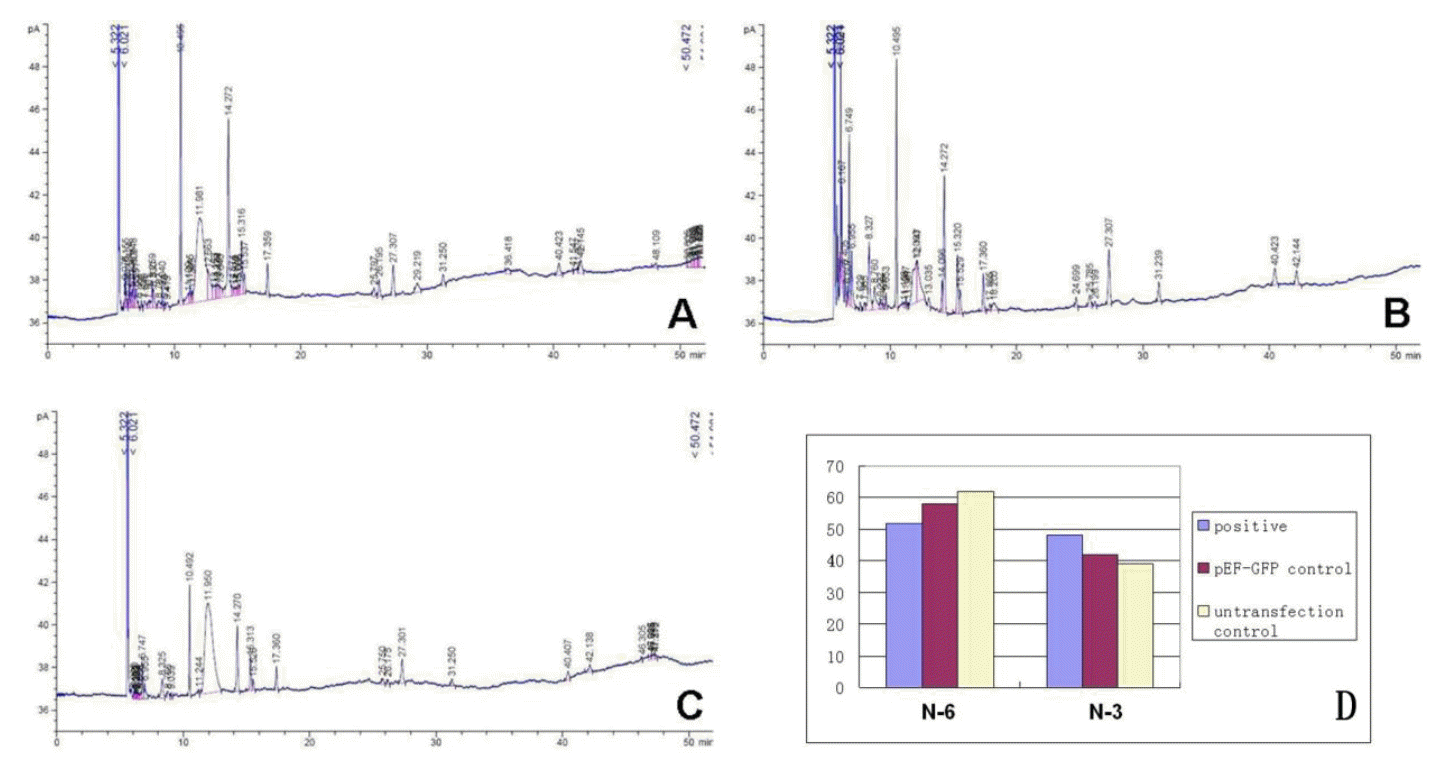
GC analysis results showed that the ratio of n-6/n-3 PUFAs in positive cells decreased from 1.384 to 1.643 to 1.0796, which is significantly lower than the pEF-GFP vector group and the control group, and close to the ideal proportion 1:1, and rose to nearly 2 fold. Among the highly unsaturated fatty acids (HUFAs) present were included EPA (20:5 n-3), DHA (22:6 n-3) and DPA (22:5 n-3) which had increased significantly. To be more specific, the EPA, DHA and DPA increased from 9.26%, 14.19% and 14.39% up to 11.26%, 19.07% and 17.76% respectively (Table 4, Figure 7), an increase of 1.22 to 1.34 fold, which was similar to Zhu’s result of sFat1 gene transferred CHO cells (Zhu et al., 2008).
DISCUSSION
N-3 PUFAs, especially HUFAs are very important in both physiological adjustment and disease prevention (Connor et al., 2007; He et al., 2009). Some research has shown that the addition of fish meal and specific n-3 fatty acids into the feed of early lactating dairy cows significantly affected the milk yield and ovarian function (Moussavi et al., 2007a, b). In addition, the oral application of DHA can improve the quality of breast milk (Gibson et al., 1997), while oral application of Alpha-linoleic acid (ALA) or EPA can not increase the PUFAs content in blood (Li et al., 1999). In previous studies, it has been reported that both transgenic Arabidopsis thaliana and transgenic oil-synthesizing seeds express n-3 PUFAs (Spychalla et al., 1997; Abbadi et al., 2004). However, mammals themselves cannot synthesis n-3 PUFAs directly, they must obtain them by ingestion from their daily ration. As one of the most important food sources, beef have great potentialities of improvement.
Short chain fatty acids can be supplied easily in terms of nutrition synthesis. They can be obtained from seaweeds or any other plant foods. However, most of the long-chain n-3 PUFAs are found in deep-sea fishes. These resources are limited because of overfishing and marine environment pollution damage. Lai produced the first transgenic pig rich in n-3 fatty acids in 2006, which showed a 15 fold and 4 fold increase, but the concentration of EPA, DHA and DPA was still at a low level (Lai et al., 2006). Zhu cloned another fat1 gene from Caenorhabditis briggsae, and called it sFat1. The results showed that sFat1 produced a marked effect in transforming n-6 PUFAs into n-3 PUFAs, including more long-chain PUFAs like EPA, DHA and DPA (Zhu et al., 2008). However, the vector was driven by two Cytomegalovirus (CMV) promoters, which have a high expression efficiency and cytotoxicity. Consequently, the biosafety was an issue. It was also found that both the EF-1α-driven and CMV-driven vectors showed relatively constant expression levels in CHO cells in terms of GFP expression (Bauer et al., 2010). In order to increase the efficiency and transgenic animal safety, our study used EF-1α as the promoter, which displayed a good efficiency in the pEF-GFP-fat1 vector and produced considerable long-chain n-3 PUFAs.
However, the efficiency of IRES promoter was invalid. Theoretically, IRES can drive both front and back open reading frame (ORF), but the distance between IRES and eGFP was unsuitable. Therefore, the expression of eGFP was not evident as fluorescent cells. However, the efficiency of transfection was not judged entirely by fluorescent microscopy as the monoclonal can be selected after adding G418 to treated cells. The optimization of IRES-eGFP is under way.
C. elegans shows codon characteristics that are similar to prokaryotes, so codon optimization is integral to this experiment. Our results also demonstrate that codon optimization based on the usage frequency preference of bovine muscle protein showed high catalysis efficiency. In the pathway of lipometabolism, n-6 PUFAs were catalyzed to n-3 PUFAs with high efficiency. This would be a useful trait to supply the lack of n-3 PUFAs ingestion from food. This study has proved that different methods of codon manipulation can play a role in the specificity of expressed proteins.
Meanwhile, the high transcription level of fat1 can produce FAT-1 desaturase in bovine fetal fibroblast cells. It can transform n-6 PUFAs into n-3 in cells while n-3 and n-6 PUFAs cannot mutually transform in untransgenic cells. The FAT-1 desaturase can manipulate enzyme substrate n-6 PUFAs, while the enzyme catalysis rate partly depends on different inserted gene integration site. Polyclone was mixed in order to eliminate the effects of the inserted gene integration site. But because of the nondeterminacy of non-gene targeting, the results cannot remain stable.
Consequently, the transgenic cells could be donors for nuclear transfer (NT) in preparation for the production of fat1 transgenic cattle. Although a large number of reports have been published, there are some problems in practical application. The research of the transgenic fat1 catalysis efficiency in vitro can lay the first stone in terms of high expression n-3 PUFAs in transgenic cattle. The results of this study have provided a good prospect for the use of transgenic technology to produce the special fish oil n-3 PUFAs for use as foodstuff. In order to raise the positive value and screen the best donor, we would like to further improve the condition of transfection and further reseach the codon sequence for the optimization of the fat1 gene.
ACKNOWLEDGEMENT
This work was supported by the National R&D. Project of Transgenic Organisms of Ministry of Science and Technology of China (2009ZX08009-156B, 2009ZX08007-005B and 2011ZX08007-001), National Natural Science Foundation of China (No.31000991), the Doctoral Program Foundation of Institutions of Higher Education of China (No. 20100061120039) and Jilin Scientific and Technological Development Program (20110229). The authors thank Ting Yuan and Qianqian Qin for assistance with experimental protocols.


