Hemato-biochemical and Cortisol Profile of Holstein Growing-calves Supplemented with Vitamin C during Summer Season
Article information
Abstract
Effect of vitamin C (VC) on biochemical, hematological and cortisol profile of growing Holstein calves during summer was investigated. Eighteen calves between 14 and 16 weeks of age were divided equally into two groups. One group received a diet supplemented with VC (20 g/d) for 60 days, while other non-supplemented diet fed group served as a control (CON). The temperature humidity index (THI) was recorded and computed during the experiment. From days 0 to 60, the THI exceeded 70. Blood samples were collected from the jugular vein of each calf at days 0, 15, 30, 45 and 60. Serum albumin and total protein decreased (p<0.05) in CON and VC calves with age. Serum glutamic-oxaloacetic transaminase concentrations were not affected by treatments. Serum creatinine, albumin and glutamic-pyruvic transaminase concentrations were higher in calves in the VC group than the CON group. While red blood cells, hemoglobin and hematocrit were lower (p<0.05) in VC calves, mean corpuscular volume, mean corpuscular hemoglobin, red blood cell distribution width and mean platelet volume were higher (p<0.05) in these VC supplemented calves. Leukocyte parameters including white blood cells and full term for lymphocytes were not affected by the treatments. Also, serum cortisol was not affected by treatments. At day 15, 30 and 45, the total VC in plasma was higher (p<0.05) in calves fed with VC. In conclusion, serum cortisols were not affected by plasma VC concentration, while some blood parameters were positively influenced in calves fed with VC.
INTRODUCTION
Ascorbic acid (AA), also termed vitamin C (VC) is an antioxidant that is essential for numerous cellular functions. It is the most abundant and important water-soluble antioxidant in mammals (Sauberlich, 1994) and is found in almost all biological fluids (Schorah, 1992). Moreover, it is considerably accumulated in endocrine tissues and cells including leukocytes where it acts as free radical scavenger (Ames et al., 2003; Schwager and Schulze, 1998). The concentration of AA plus dehydro-L-ascorbic acid (DHAA) is equal to the VC concentration in biological fluids because it is readily converted to AA.
Most mammals synthesize their own AA and so it is often not considered an essential nutrient. Domestic animals such as ruminants, swine, horse and poultry can synthesize AA. AA is produced by the liver in all domestic animals. Lundquist and Phillips (1943) reported that AA synthesis begins in calves between weeks 2 and 3 of life. However, Bouda et al. (1980) reported that adult levels of VC were not present in calves until after 3 months of age. Therefore, a young calf relies on AA in milk, which is relatively low (Wegger and Mustgaard, 1982). On the other hand, milk often is exposed to air and light, which may destroy VC before the calf consumes it. Consequently, hypo-vitaminosis C is a potential problem for dairy calves, whose only source of VC for the first few weeks of life is bucket-fed or bottle-fed milk, or a milk replacement.
Although, cattle can synthesize VC in the liver, lower plasma VC concentrations in cattle have been reported during pathological and thermal stress (Weiss, 2001). Clinical cases of scurvy, which is a sign of VC deficiency, have been described in cows (Duncan et al., 1944) and calves (Cole et al., 1944). These conditions can contribute to, and lead to, the onset of health disorders in cattle and calves (Miller et al., 1993). Also, VC deficiency can reduce the formation of carnitine, which can result in accumulation of triglycerides in blood, and in physical fatigue and lassitude associated with scurvy (Ha et al., 1994). Lundquist and Phillips (1943) reported that supplementation with VC improves immune function and enhances the resistance to infection in calves. On the other hand, McDowell (1989) reported that the supply of VC for ruminants depends mostly on the synthesis of AA in the liver, since dietary VC is easily degraded in the rumen and ruminants may be more prone to VC deficiency than other animals when AA synthesis is impaired.
Ascorbate has been successfully used to partially or completely alleviate the climatic stress in chicken and pigs. Supplementation of VC reduces the incidence of diarrhea in calves (Cummins and Brunner, 1989) and stimulates recovery from acute mammary inflammation in dairy cows (Chaiyotwittayakun et al., 2002). However, no effort has yet been made to examine the influence of VC on stress physiology of growing dairy calves during summer. Moreover, thermal stress during summer could possibly further add to problem of hypo-vitaminosis C in calves. Furthermore, a dietary requirement for VC has not been recommended for these animals.
In Korea, higher temperature and humidity during summer affect the performance of dairy cattle and growth of calves. This study was conducted to examine the effect of feeding ruminally protected VC on the serum cortisol and blood metabolites of growing Holstein calves.
MATERIALS AND METHODS
Calves, feeding and treatments
This study was conducted at the National Livestock Research Institute from August to October, 2008. Eighteen female Holstein calves were divided equally and randomly assigned to two groups. The calves were fed with a basal diet (Table 1) twice daily at 0900 and 1700 h. Control (CON) calves (n = 9) were fed without VC supplementation. The other nine calves in the VC group were fed a diet supplemented with VC (20 g/d). The experiment was carried out for 60 days. VC supplementation was prepared by mixing a small amount of concentrate mixture with 20 g of VC. The supplementation was given once before morning feeding. After the VC supplementation was completely ingested, the remaining feed was given. The calves were housed in a tie-stall barn and allowed free access to water from a bowl drinker and free access to a mineral block.
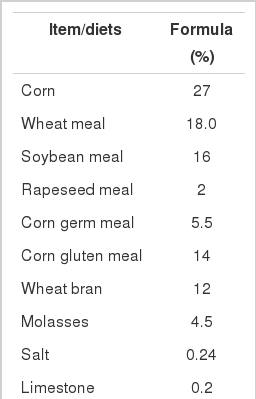
Feed composition of basal diet fed to Holstein growing calves
Sampling and analysis
Fifteen days prior to blood collection, the mean daily temperature humidity index (THI) was recorded. The THI was calculated as proposed by utilizing maximum temperature (°C) and average relative humidity (%) using the following equation:
It was observed that the THI is above 70.
In obtaining serum, blood samples were collected before giving the supplementation or before the morning feeding on each sampling day. Blood samples were collected from the jugular vein of the calves before the second feeding (1100 h) on days 0, 15, 30, 45 and 60 using 10-ml evacuated tubes (BD, Franklin Lakes, NJ, USA) without anticoagulant and with 5 ml ethylenediaminetetraacetic acid (EDTA). The blood samples collected without anticoagulant were centrifuged at 1,000×g for 20 min at 4°C and the serum was partitioned into aliquots and stored at −20°C until analysis. The analyses included albumin, calcium, creatinine, globulin, glucose, glutamic-oxaloacetic transaminase (GOT), glutamic-pyruvic transaminase (GPT), total protein and blood urea nitrogen (BUN), and were performed using a model 7,180 serum analyzer (Hitachi, Tokyo, Japan). The blood samples collected with EDTA were used to determine concentrations and percentages of leukocytes including white blood cells (WBCs), neutrophils (NE), eosinophils (EO), basophils (BA), monocytes (MO) and lymphocytes (LY); erythrocytes (red blood cells, (RBCs)); thrombocytes (platelets, PLT); hemoglobin (Hb) and hematocrit (HCT). As well, mean corpuscular volume (MCV), mean corpuscular hemoglobin (MCH), mean corpuscular hemoglobin concentration (MCHC) and red blood cell distribution width (RDW), and thrombocytes (mean platelet volume (MPV)) were determined. These blood parameters were analyzed using a Hemavet 950 hematology analyzer (Drew Scientific, Dallas, TX, USA).
For total VC determination in plasma, the samples were mixed with 9 g/L reducing reagent (dithioerythritol (DTE)) solution and diluted 3-fold with ice-cold DTE in methanol (1 g/L). The samples were mixed and centrifuged at 10,000 ×g for 2 min. Each supernatant was passed through a 0.45 μm filter and stored at −20°C until further analysis. Twenty microliter aliquots were injected into a high-performance liquid chromatography (HPLC) system consisting of a spectrophotometric detector and a reverse phase HPLC column (Symmetry C18 4.6 mm×150 mm, Waters Korea). The mobile phase was 1 mmol/L ammonium formate, 7 mmol/L dodecyltri- methylammonium bromide and 40% methanol. Elution was isocratic at a flow rate of 0.9 mL/min and the eluent was monitored at 275 nm. This HPLC method was based on the analytical method for the synthesis of ascorbic acid in human plasma (Patriarca et al., 1991).
Serum cortisol was assayed using the DELFIA cortisol kit (Wallac Oy, Turku, Finland). The assay is a solid phase time-resolved fluoroimmunoassay based on the competitive reaction between europium-labeled cortisol and sample cortisol for a limited amount of binding sites on cortisol specific, biotinylated monoclonal antibodies.
Statistical analysis
Serum cortisol and plasma VC concentration data were analyzed by Student’s t-test, while the blood metabolite data were analyzed by Analysis of Variance (ANOVA) using general linear model (GLM) for randomized complete block design. The treatments were replicated nine times. Duncan’s
Multiple Range Test (DMRT) was used to compare specific treatment differences. To describe the functional relationship between the treatment levels, the linear and quadratic effects of VC between treatments were analyzed. All test of significance was compared at the five percent probability level. All analyses were carried out using Statistical Analysis Systems (SAS) version 9.1 (2002).
RESULTS AND DISCUSSION
Temperature, plasma VC and serum cortisol
The average THI at d 0, 15, 30, 45 and 60 was 85.2, 78.0, 80.4, 79.7, and 71.6, respectively (Figure 1). It was readily apparent that the THI exceeded 70 from days 0 to 60. Maximum mean THI exceeding 72 is considered a critical value at which heat stress affects dairy cows (Johnson, 1980). Although knowledge of THI alone is beneficial in determining the potential for heat stress, wind speed and solar radiation, adjustments to the THI more accurately assess animal discomfort (Huber, 1996).
THI during the experiment. The THI was calculated using the following expression: THI = (0.8×Tmax)+(% average RH/100)×(Tmax-14.4)+46.4 (Nienaber et al., 1999).
Having THI of above 70 in summer may have a great effect on several factors. Mitchell and Russo (1983) reported that high ambient temperature has been proposed to increase production of oxygen-derived free radicals that cause some of the effects of heat stress. Moreover, heat stress is responsible for alterations of the immune response that depend on the type of immune response and the length of time that calves are exposed to the stressor (Broucek and Kovalcik, 1989). Padilla et al. (2006) reported that the suppression of glycogenolysis may reduce AA synthesis in heat stressed cows. Moreover, Singh and Newton (1978) confirmed that young calves have a well-developed ability to acclimate to high temperatures. Thus, VC supplementation in growing Holstein calves may prevent heat stress on summer, vitamin deficiency and infection.
Plasma VC (ascorbic acid+dehydroascorbic acid) concentration is a good index of the nutritional status of VC. McKee and Harrison (1995) and Sahin et al. (2003) reported that supplemental VC improves feed intake and growth rates in heat stressed birds. Figure 2 shows the mean±SE concentration of plasma VC in growing Holstein calves. The average concentration of plasma VC was significantly higher (p<0.05) in calves fed the basal diet supplemented with VC compared with those fed only with basal diet at d 15, 30 and 45. The results are compatible with those of Padilla et al. (2006), who reported that the plasma VC concentration of lactating cows is lower in summer than in autumn. In addition, Cummins and Brunner (1991) reported a reduced plasma VC levels in calves stressed by housing conditions. Thus, THI is also a factor in plasma VC concentration, which was presently lowered significantly in the CON group than in the VC group. This likely reflects the low levels of VC in calves <3 months of age (Bouda et al., 1980). Plasma VC level was affected by the synthesis and consumption of AA. Moreover, endogenous VC production may be insufficient for cattle under some conditions (Padilla et al., 2006). VC supplementation during the summer season may be needed to increase plasma VC, as heat stress decreases plasma vitamin C levels in pigs (Ricker, 1967). Moreover, Harmon et al. (1997) mentioned that heat stress decreases antioxidant activity in the plasma of lactating cows. VC supplementation increases plasma VC, which may prevent heat stress as well as improving feed intake and growth rate of Holstein calves.
Mean (±SE) plasma VC concentrations of VC and non-VC fed Holstein calves. * Means are different (p<0.05) between treatments. ** Means are different (p<0.001) between treatments.
Cortisol concentration has been used for decades as a physiological marker of stress in animals (Yates et al., 2008). Determination of serum cortisol would help determine whether animals are undergoing heat stress or not. Vitamin C increases the use of corticosteroids released during stress (Pardue and Thaxton, 1984). Since this experiment was done during summer, heat stress is possible. Mean serum cortisol values of growing Holstein calves are shown in Figure 3. Serum cortisol concentrations were not significantly different in both groups. Serum cortisol values were initially higher (57.1%) in calves fed the basal diet with added VC than in those fed the non-supplemented basal diet and less (38.9%) in calves fed VC at day 0. However, a similar level in cortisol values of both groups of calves was observed after d 30 and 60. Thus, serum cortisol levels had no effect on plasma VC concentration in both treatments. Reports on the effect on guinea pigs fed massive amounts of AA indicated high levels of plasma cortisol (Encarnacion et al., 1974), but intake of 2 and 200 mg AA per day had no effects on plasma cortisol content in normal humans (Shilotri and Bhat, 1977). Also, Zhou et al. (2003) reported that serum cortisol concentrations were not significantly different among groups of turtles fed basal diet and diets supplemented with 250, 500, 2,500, 5,000 or 10,000 mg/kg VC. The results indicate that the amount of supplemented VC might affect the serum cortisol level obtained. On the other hand, Braun et al. (1994) reported that the synthesis of AA was increased in mouse hepatocytes when the breakdown of glycogen was stimulated by glucagon, but that the addition of glucose to the medium did not affect the synthesis, which suggests that the supply of glucose-1-phosphate from glycogen breakdown must provide UDP-glucose for AA synthesis. Basal diet (Table 1) and free access to mineral block might have been sufficient to counter the stress and might have been also a factor in maintaining serum cortisol.

Mean (±SE) serum cortisol levels of VC and non-VC fed Holstein calves.
Hematology and serum chemistry
VC is required for the synthesis of collagen and dentin. Collagen is the structural component of blood vessels, bones, ligaments, and tendons, while dentin is the structural component of teeth. Table 2 summarizes the data on blood chemistry in VC and non-VC fed Holstein calves. During the whole period of the experiment, albumin, creatinine, glucose, and GPT were significantly higher in calves fed with VC-supplemented basal diet, while globulin displayed the opposite. CA significantly increased as the calves grow older, while globulin, total protein and BUN significantly decreased. The CA increase likely occurred because VC helps absorb calcium and iron in order to keep blood, bones, tendons and cell reproduction healthy. Blood albumin, creatinine and GPT concentrations were significantly higher (p<0.05) in calves fed the VC-enriched basal diet than in calves fed only basal diet on day 15, 30, 45 and 60. Glucose was significantly higher only at d 0 in calves fed basal diet +VC. This result is comparable with glucose content obtained by Seifi et al. (2010), wherein addition of VC to a basal diet had no significant effect on neonatal dairy calves. On the other hand, BUN concentration was significantly lower (p<0.05) in calves fed only the basal diet than in those fed with VC-supplemented basal diet on d 45 and 60. Moreover, total protein concentrations were inversely proportional to calves age; as the calves aged, the total protein declined. In addition, total protein concentrations were significantly lower (p<0.05) in calves fed the VC-enriched basal diet than in those fed only the basal diet. The results were similar to the result obtained by Doornenbal et al. (1988), wherein total protein levels were lower (p<0.05) in young animals (except for the values at birth) and higher in mature animals. GOT was not affected by treatments.
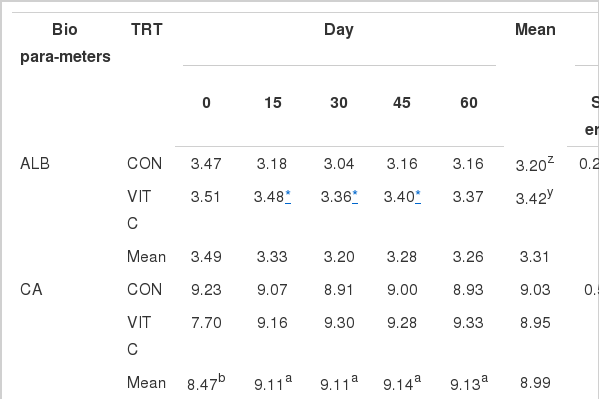
Blood chemistry in VC and non-VC fed Holstein calves
Serum proteins constitute a portion of the amino acid pool of the body and, as such, are believed to be indicative of the nutritional status of the animal. Biochemically, higher blood total protein and albumin concentrations in older calves were probably affected by the composition of DM and CP. However, the albumin concentration in both treatments was in the normal range. The results obtained for albumin content agree with those reported by Seifi et al. (2010). Higher BUN were observed at days 45 and 60 in the VC group of calves compared with CON calves, which may be due to the higher rates of protein degradation or deamination because of higher protein intake and probably a more functional rumen (Hadorn et al., 1997). Creatinine concentration is more specific than BUN with regard to renal function in the cow and the horse, because gastrointestinal excretion or absorption does not occur. The rumen microflora metabolizes a larger percentage of urea than the enteric flora in monogastrics, often preventing BUN concentrations from increasing proportionately with creatinine levels in cattle (Miller et al., 2004). Presently, the creatinine concentration in the calves fed only the basal diet was below the normal range at d 15, 30, 45 and 60. Creatinine is the excretion form of creatine compounds. It is phosphorylated in the muscle, forming a reservoir of readily available high energy. Because creatine is contained almost entirely in striated muscle, the amount of creatinine released is related to the muscle mass. Low levels may be a consequence of decreased muscle but may also be occasionally found in advanced liver disease.
Hematological values in VC and non-VC fed Holstein calves are shown in Table 3. In comparison between treatments as a whole, MCHC, MCV, MPV and RDW were significantly higher in calves fed basal diet added VC, while Hb, HCT and RBC were significantly lower. As the calves aged, BA, EO, HCT, MCV, NE, PLT, RDW and WBC significantly increased. WBC and LY were not affected by treatments. NE (d 15), RBC (d 15, 30, 45 and 60), Hb (d 15 and 30) and HCT (d 15, 30, 45 and 60) were significantly lower in calves fed the VC-supplemented basal diet than in those fed with only the basal diet. On the other hand, MCV, MCH and RDW on d 15, 30, 45 and 60, and MPV on days 15, 30 and 45 were significantly higher in calves fed the VC-enriched basal diet than in those fed with only the basal diet. Based on the reference values published by Mohri et al. (2007), WBC, NE, LY and RBC were in the normal range in both the VC and CON groups. On the other hand, Feldman et al. (2006) reported that in cattle the normal range of blood values for the following parameters were: Hb = 8–15 g/dl, MCV = 40–60 fL and MCH of 11–17 pg. In this study, calves fed a VC-containing diet showed below normal range values of Hb, MCV and MCH; in particular, Hb had lower values in VC calves than CON calves. Low Hb may lead to anemia; however, values obtained were only slightly lower than normal. This was not considered significant and no symptoms were evident. On the other hand, MCV and MCH values were significantly higher in VC calves than in CON claves, which means that supplementation of VC might have been a factor in the increase of these parameters. MCV refers to the size of each RBC and MCH refers to the concentration of Hb in each RBC. If MCV and MCH are low, it means the RBCs are smaller than average (MCV) and paler than average (MCH), and cannot carry as much oxygen as normal. This may lead to iron deficiency anemia. Moreover, Dallak (2009) reported that lower MCV is due to an increase in the rate of RBC destruction or due to decreased synthesis and release of erythrocytes in circulation. Heat stress can disrupt normal physiological pathways and cause erythrocyte destruction (Lee et al., 1976). Low MCV allows classification as a microcytic anemia and low MPV is associated with an increased risk of bleeding. Also, a low MPV value can be correlated primarily with thrombocytopenia due to impaired production in aplastic anemia. The measurement of MPV can reflect changes level of platelet stimulation (el-Sayed, 1996) and may be a simple marker for activation of platelets.

Hematological values of VC and non-VC fed Holstein calves
CONCLUSION
The present study revealed that 20 g/d vitamin C supplementation in growing Holstein calves during summer results in improved hemato-biochemical and hematological profile in terms of total plasma vitamin C, with no effect on serum cortisol. Further studies on the comprehensive VC dose response relationship with several attributes including growth performance and feed intake are warranted before recommending its use as a dietary supplement.
ACKNOWLEDGEMENTS
This work was carried out with the support of “Cooperative Research Program for Agriculture Science & Technology Development (Project No. PJ0074512012)” Rural Development Administration, Republic of Korea.