


INTRODUCTION
Meat adulteration using non-halal meats is a serious matter because certain religions such as Muslim and Judaism are not allowed to consume non-halal foods. Moreover, Muslim applies the strict regulation regarding halal products according to the Shariah law. Halal is not only associated with religion but also to a healthy life style [1]. The demand for halal foods has been reported to be increasing worldwide due to their quality and safety [2]. Beef (BMr) is one of the favorite meats consumed by people around the world due to its high nutrition and taste. In market place, the price of BMr is higher compared to other meats, thus make it prone for adulteration [3]. Non-halal meat such as dog meat (DMr) and pork (PMr), are widely spread in Southeast Asia countries including Indonesia, Malaysia, and Thailand. These meats have a lower price and similar physical appearances as beef. DMr and PMr are often mixed with beef and labelled as pure beef to get the additional profits by unethical players and producers [4]. This is a serious problem because it could harm consumers.
Various analytical methods such as gas chromatography [5], liquid chromatography [6], Fourier transform infrared spectroscopy [7], near infrared spectroscopy [8], Raman spectroscopy [9], and DNA-based methods [10] have been developed for the detection of non-halal meats in meats and meat-based products. Methods based on molecular analysis such as polymerase chain reaction (PCR) and real-time PCR to detect a DNA target have been widely applied for meat authentication purposes, some countries even apply RT-PCR as the standard method [11]. However, several factors such as processing treatments and temperature could degrade DNA, therefore, sometimes the non-halal DNA can not be detected using RT-PCR [12,13]. Moreover, RT-PCR technique is not a simple technique because of its complex sample preparation steps and costly reagents [14]. Therefore, the development of powerful and robust analytical methods to detect non-halal meats with high accuracy and high reproducibility is a must.
Recently, the omics technology such as metabolomics has been widely applied in numerous research including analysis and authentication of foods [15]. Metabolomics is a comprehensive study intended to identify an enormous number of metabolites from certain samples at a particular condition [16]. Metabolomics could be used for the identification of metabolites composition in meats and to investigate the difference of metabolites among meats [17]. The untargeted metabolomics approach demonstrates some advantages for authentication of food products due to its capability to screen as many metabolites as possible in food products. Liquid chromatography-high resolution mass spectrometry (LC-HRMS) has been used for untargeted metabolomics research because of its capability for metabolites screening with high throughput capacity. Moreover, it has high sensitivity, high specificity, and high resolving power for metabolomics analysis [18].
The advanced statistical tools such as chemometrics, is obviously required for untargeted metabolomics approach due to the vast amount of data resulting from an untargeted measurement. Chemometrics could be used to handle and process the huge data from untargeted LC-HRMS metabolomics analysis [19]. Some of the chemometrics techniques such as pattern recognition using principal component analysis (PCA), discriminant analysis (DA), partial least square discriminant analysis (PLS-DA), soft independent modelling class analogy (SIMCA) along with multivariate calibrations of partial least square (PLS) and principle component regression and many more [20] have been used during food authentication. The combination of metabolomics analysis using Liquid chromatography-mass spectrometry (LC-MS) based method and chemometrics has been widely used in various research for food authentication including halal authentication analysis of meats. Chemometrics analysis could be used to identify halal and non-halal samples based on their metabolite patterns. Moreover, chemometrics has the capability to investigate potential biomarkers which are very useful for the identification and differentiation of the studied samples [20,21].
Differentiation of chicken meats obtained from two slaughtering methods, zabiha (halal) and non-zabiha (non-halal) was successfully performed using untargeted LC-HRMS metabolomics [22]. A study on the metabolite differences between chicken meats obtained from normal slaughtering and dead-on chicken meats has also been performed by Sidwick et al [23] using LC-HRMS combined with chemometrics. Moreover, detection of pork adulteration in beef by focusing on lipid metabolites has been investigated by using LC-HRMS untargeted approach. Some potential biomarkers important for such differentiation also could be extracted using chemometrics analysis [24]. The presence of pork as adulterant in beef meatballs has also been successfully analyzed using LC-HRMS and pattern recognition chemometrics by employing an untargeted metabolomics approach. Moreover, multivariate regression was applied to create a prediction model [25]. However, studies on the analysis of non-halal meats such as pork and dog meat in high quality of halal meats using an untargeted LC-HRMS metabolomics and chemometrics are still limited.
To our best knowledge, there is no report on the analysis of DMr and PMr adulteration in beef for halal authentication using a non-targeted LC-HRMS metabolomics combined with chemometrics. Therefore, the main objective of this study was to develop an analytical method for halal authentication of beef from DMr and PMr adulteration by employing an untargeted LC-HRMS metabolomics. In addition, chemometrics was applied to identify discriminating metabolites potential for biomarkers important for the differentiation of samples.
MATERIALS AND METHODS
Materials
All LC-MS hypergrade solvents (methanol, water, acetonitrile), HPLC grade solvent of methanol, and formic acid were obtained from Merck (Darmstadt, Germany). The standard solution of positive and negative calibration solution (Pierce LTQ positive and negative) for mass spectrometry were purchased from Thermo Fisher Scientific (Rockford, IL, USA).
Sample collection and preparation
Beef (n = 5) sample was obtained from five different markets in Yogyakarta and Central Java, Indonesia. Pork (n = 3) and dog meat (n = 3) were purchased from three different meat sellers in Yogyakarta, Indonesia. The loin part was used for metabolomics analysis. The meat samples were stored at −20°C prior used for extraction. Each type of meat was ground using a meat grinder to obtain ground meat, then stored to −20°C until used for analysis. Each meat obtained from all locations were mixed. The samples of pure beef, pork, and dog meat as well as the binary mixtures of beef-pork and beef-dog meat were prepared in triplicates.
Metabolite extraction
The extraction of metabolites for metabolomics analysis was carried out based on the method by Wang et al [14] subjected to slight modifications. Pure BMr samples and those adulterated with DMr and PMr using various concentration levels (0.1%, 1%, 5%, 10%, 25%, and 50% w/w) were prepared. The ground meat was weighed, and the mixtures were prepared in a total weight of 5 g. Samples were placed into a Beaker glass and added with methanol (25 mL). Subsequently, samples were vortexed for 60 s, then ultrasonicated for 30 min at room temperature. The protein was precipitated by storing the samples at −20°C for 1 hour. The supernatant was collected by centrifugation for 10 min at 4°C at 5,000 rpm. The 1 mL of supernatant was pipetted and filtered using PTFE filter 0.22 μm. The filtered supernatant was placed into a clear 2 mL HPLC vial. Three replicates of each sample were prepared.
Metabolomics analysis
Metabolomics was performed according to our previous study with slight modifications [25]. Separation of compounds was carried out using an ultra-high performance liquid chromatography (UHPLC Vanquish; Thermo Scientific, Rockford, IL, USA) equipped with a binary pump. Two mobile phases consisted of water containing 0.1% formic acid (A) and methanol containing 0.1% formic acid (B) were used for eluting sample with the flow rate of 0.30 mL/min. An Accucore C-18 column (100 mm×2.1 mm×2.6 μm) was used for separating metabolites in samples which was injected at 10 μL. The temperature of column was set at 40°C during the compound’s separation. Elution was carried out using gradient mode as follows; at first, the mobile phase was set at 95% A, then continue to for 10% A at 16 min. Then, maintained at 10% A until 30 min before setting back to 95% A (35 min). The detection of compounds was performed using a high-resolution mass spectrometer (Orbitrap Q-Exactive; Thermo Scientific, USA). The flow rate setting for sheath gas was 32 arbitrary unit (AU), followed by auxiliary gas of 8 AU and sweep gas of 4 AU, respectively. The setting for parameter of capillary temperature was 320°C followed by gas heater temperature of 30°C. The ionization was performed in both electro spray ionization (ESI) positive and ESI negative modes with MS1 resolution of 70,000 and MS2 resolution of 17,500. The screening of compounds was carried out at m/z range of 66.7 to 1,000 m/z.
Data processing
The Compound Discoverer (Thermo Scientific, USA) software was used to identify metabolites composition in BMr, DMr, PMr, and their mixtures. The raw total ion chromatogram (TIC) both of sample and blank was used for analysis. Spectrum selection, retention time alignment, feature detection, and metabolite identification were performed. The Chemspider and MzCloud database were used for database matching. Analysis was performed using an untargeted workflow. Only metabolites having full match MS2 fragmentation and error mass between −5 and 5 ppm were selected. The metabolite dataset was converted into an excel file for chemometrics analysis.
Chemometrics analysis X
The selected metabolites from metabolite identification analysis were used as variables for chemometrics. The data were subjected to unit variance scaling prior to chemometrics analysis. Both pattern recognition and multivariate calibration chemometrics were applied. Chemometrics analysis was conducted using a SIMCA 14.1 (Umetrics, Umea, Sweden) software and Metaboanalyst 5.0 platform. Principal component analysis was performed and observed using PCA score plot, PCA loading plot, R2, and Q2 values. The PLS-DA was further used and evaluated using R2X, R2Y, Q2 values, loading score and loading plot. Validation tests such as permutation test, predicted residual error sum of squares (PRESS) value, and receiver operating characteristics (ROC) test were used for PLS-DA. The identification of discriminating metabolites potential as metabolite markers was conducted using variable importance for projection (VIP) test by identifying the variables with VIP more than 1.0. The metabolites were then subjected to analysis of variance (ANOVA) analysis. Metabolites were with p-value <0.05 were considered as significant metabolites in line with the increase of pork and dog meat levels. Multivariate calibration of PLS as well as its orthogonal form (OPLS) was used to build prediction model. The models were evaluated using the PLS plot, R2, and the residual plot. Validation of PLS dan OPLS was performed using root mean square error of cross validation (RMSECV) and root mean square error of estimation (RMSEE).
RESULTS AND DISCUSSION
Metabolomics analysis using LC-HRMS
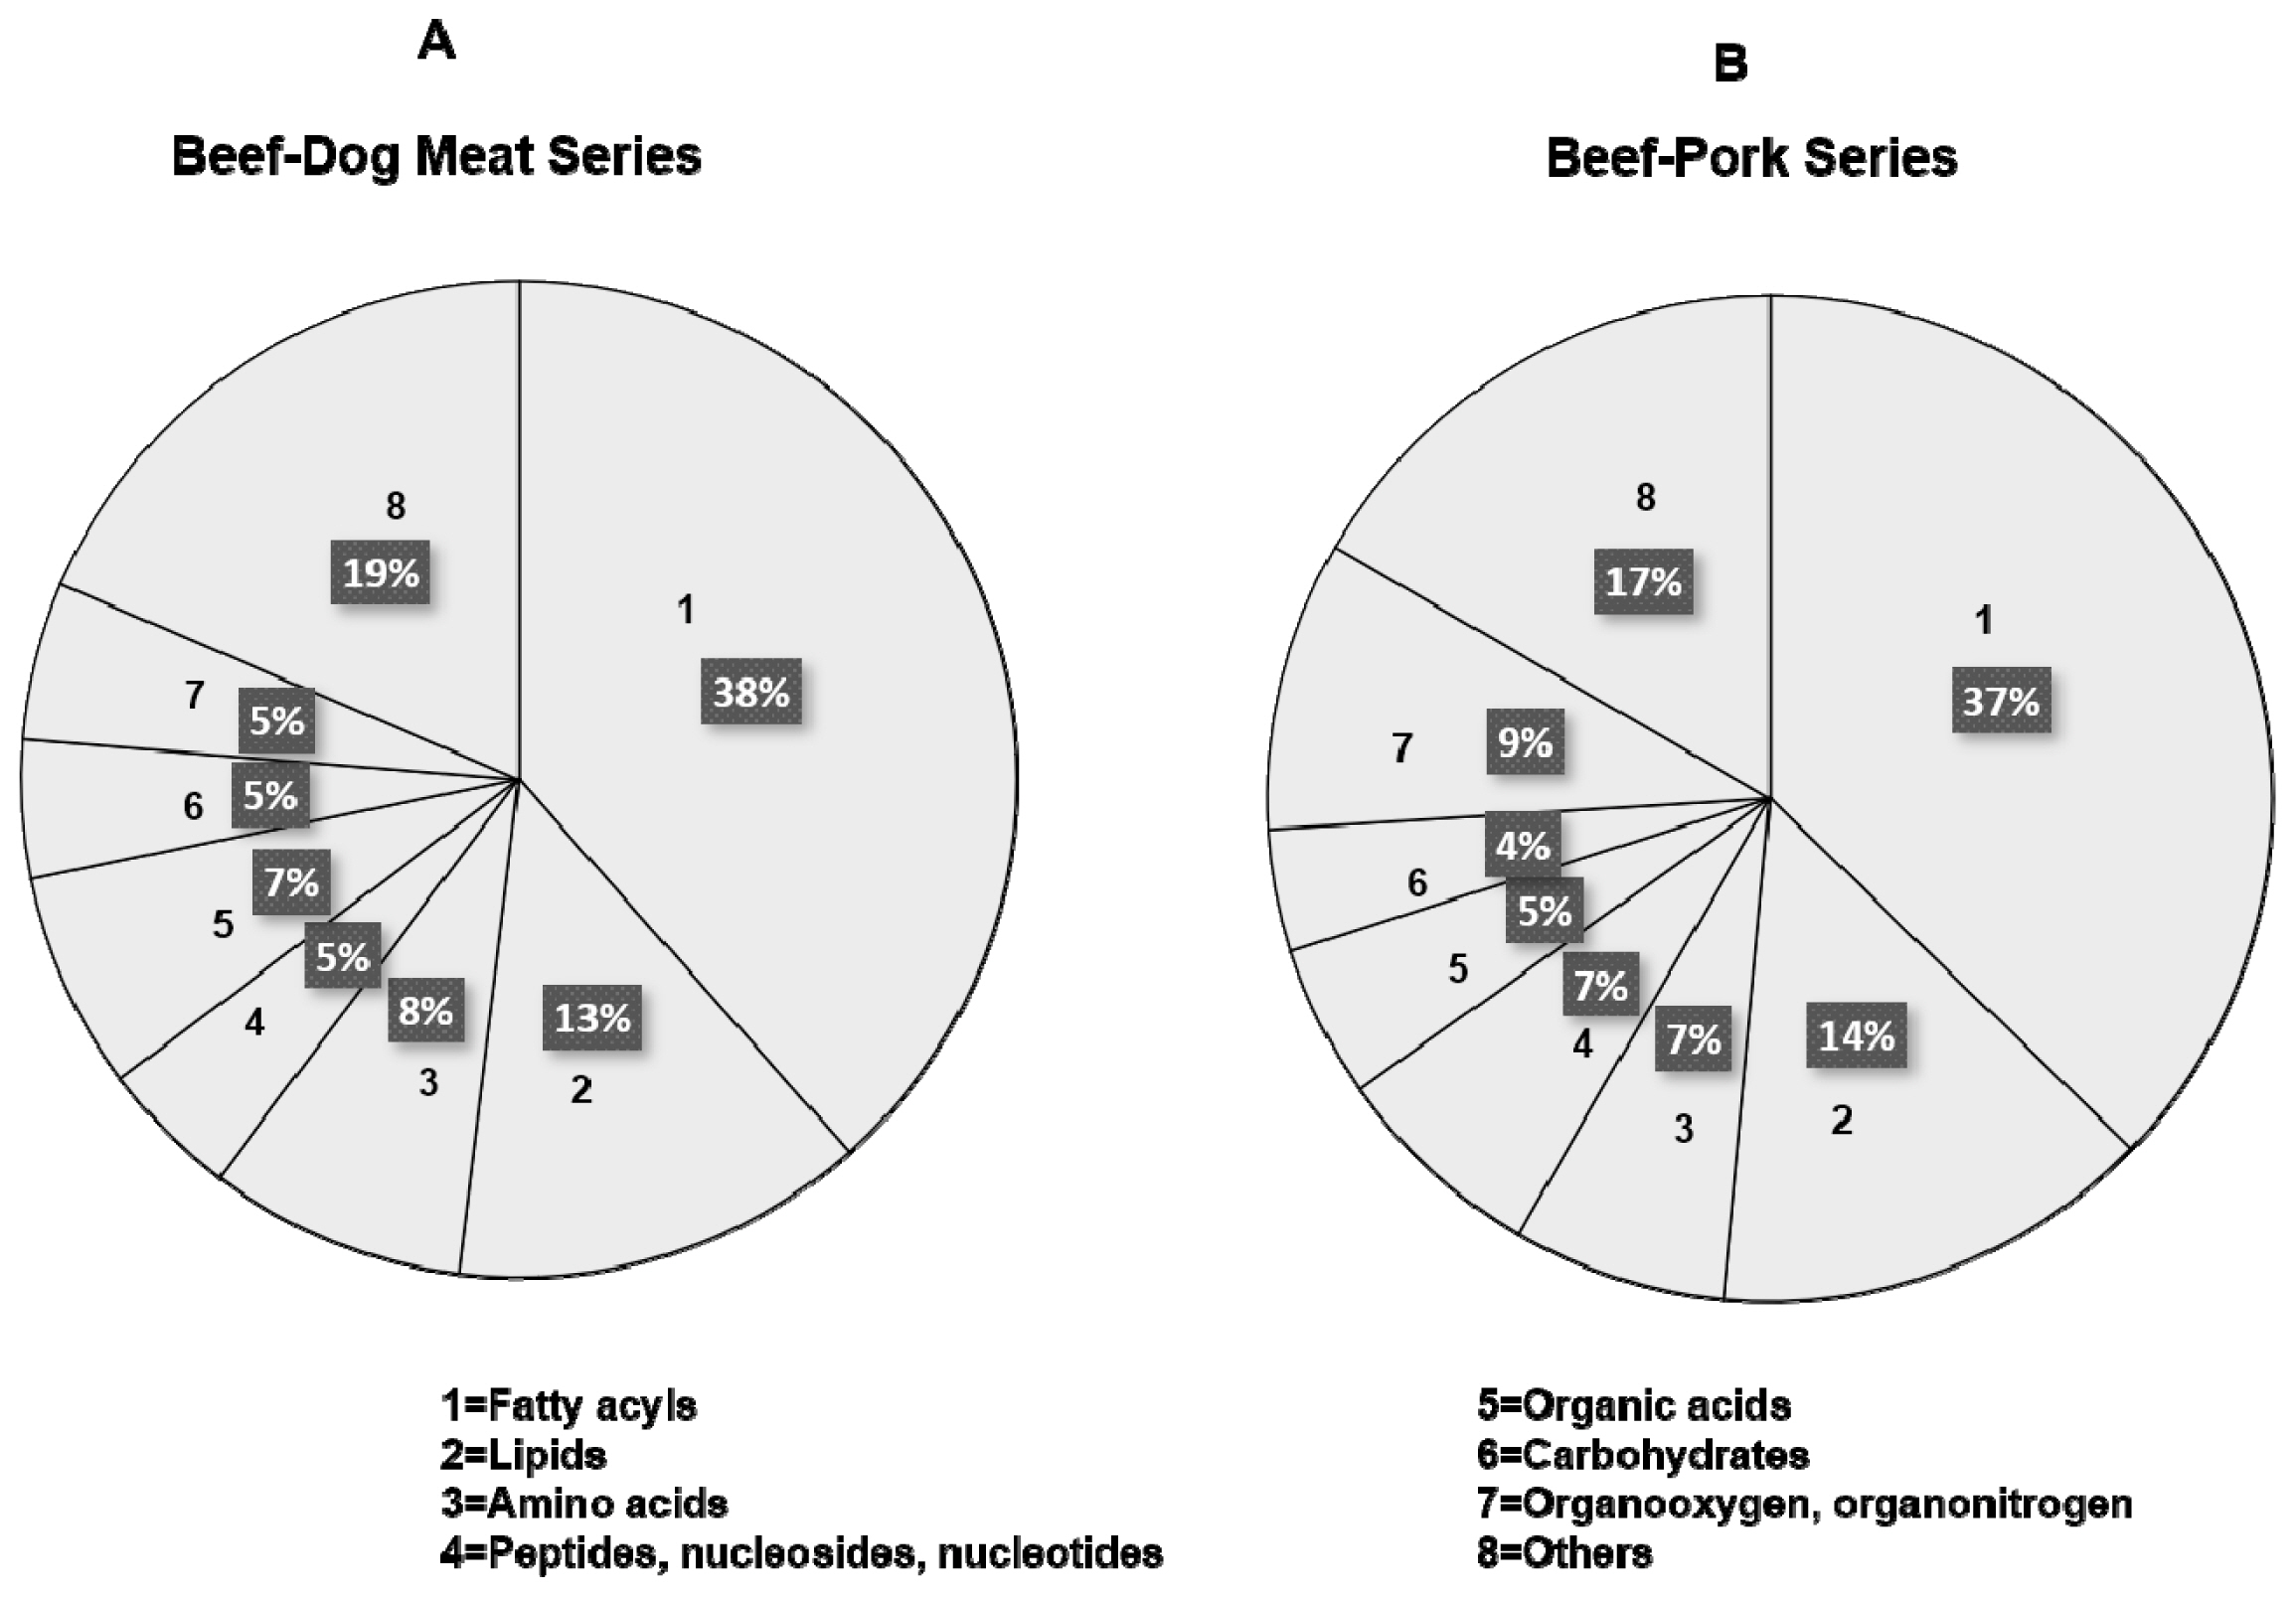
Metabolomics analysis using LC-HRMS employing an untargeted workflow revealed a wide number of metabolites contained in BMr, DMr, and PMr. Figure 1 shows the TIC from BMr, DMr, and PMr exported from XCalibur software. In general, the samples showed a similar TIC pattern, however, deep investigation found some peak differences at the retention time between 14.0 and 24.0 min. Analysis on the TIC against the databases using Compound Discoverer software could retrieve the metabolite compositions on each sample. Figure 2 illustrates the identified metabolites from beef-dog meat and beef-pork series measured using LC-HRMS metabolomics. Fatty acyls class placed at the highest proportion followed by lipids in both sample series which consist of various types of fatty acids and polar lipids such as phospholipids. Various types of amino acids and organic acids were also identified. The results was in accordance with previous reports as fatty acids, lipids, and amino acids were reported to be present in high amount in meats [26]. In addition, it was found that creatine had the highest peak area in all types of meat (BMr, DMr, and PMr), followed by carnitine. It was in agreement with previous research reporting that meats such as beef, pork, and chicken contained high amount of creatine and carnitine [27]. Due to the complexity of the identified metabolites in BMr, DMr, and PMr samples, therefore, an advanced statistical tool is required to analyze the data for the authentication purposes to guarantee the results.
Chemometrics of pattern recognition
In this study, PCA was first applied to observe the pattern of samples grouping based on their metabolite compositions. Using seven principal components (PCs), PCA could differentiate pure BMr samples with those adulterated with DMr at several concentration levels, especially in high levels of DMr (10%, 25%, and 50%) with R2 = 0.877 and Q2 = 0.577. However, in the presence of low concentration of DMr (0.1%, 1%, and 5%), PCA could not clearly differentiate between pure and adulterated samples (Figure 3A). On the other hand, PCA using five PCs subjected to metabolites data from beef-pork series cloud clearly differentiate authentic BMr, BMr adulterated PMr, and pure PMr with R2 = 0.680 and Q2 = 0.403 as depicted in Figure 3B. The tight cluster of the quality control (QC) samples in the PCA score plot confirmed the stability and the reproducibility of the LC-HRMS method in both sample series. PCA is an unsupervised pattern recognition that has been widely used in many fields of research including metabolomics to find out the similarity and dissimilarity among samples by reducing the number of original variables into few PCs. Samples with score plots appeared close to each other indicates high similarity and vice versa [19]. In this study, the obtained PCA showed that the higher the presence of adulterant in BMr, the closer the score plot to the score plot of adulterant both in beef-dog and beef-pork model. However, the separation among levels in adulterated samples is not clear enough such as a few of score plots are still overlapping. It might be caused by losing some information or data distortion when reducing the data dimensionality [16].
To confirm the PCA results, supervised pattern recognition of PLS-DA was further used to discriminate and classify samples. PLS-DA using four latent variables (LV) clearly discriminated BMr, BMr adulterated DMr, and DMr samples with R2X = 0.797, R2Y = 0.961, and Q2 = 0.803. The score plot of PLS-DA in Figure 4A shows that the lowest level of DMr (0.1%) was clearly discriminated from the authentic BMr indicating a good performance of the PLS-DA model for discriminating adulterated samples at low concentration of adulterant. In addition, PLS-DA was also successfully used to discriminate between authentic and adulterated BMr with PMr, with high accuracy as depicted in Figure 4B. Using 9 LV, PLS-DA could detect and discriminate all adulterated samples from the authentic BMr samples with R2X = 0.774, R2Y = 0.960, and R2Y = 0.563. According to the PLS-DA score plot, the higher the level of the adulterants given, the closer the score plot to the adulterant meat, observed in both models. The table of misclassification test showed there is no misclassification found in both PLS-DA model of beef-dog and beef-pork series indicating the high accuracy of the classification models. In addition, the stability and reproducibility of the LC-HRMS method was confirmed by the tight cluster of QC samples.
Supervised PLS-DA is a combination of PLS regression and linear discriminant analysis. The PLS model was first built using the X matrix (independent variables), followed by Y matrix (dependent variables). Subsequently, the LV, also called factors were searched and used for classification. These LV made PLS-DA capable of returning better sample differentiation than using PCA. This result was in agreement with previous studies reporting the suitability of PLS-DA for sample classification of meat from different origins, for detection of pork in halal meats, and for metabolite differentiation of chicken during storage [14,28].
However, supervised pattern recognition such as PLS-DA is susceptible for model overfitting thereby could provide bias result. Therefore, such validation tests including permutation test and ROC test are often required to demonstrate the model validity. The permutation test performed using 999 permutations confirmed the validity of PLS-DA model both in BMr adulterated DMr and BMr adulterated PMr series. In the BMr adulterated DMr model, permutation using six components showed that the original variables had the highest value among all the permutated models with the intersection of Q2 value was between zero and below zero, (0.0, −0.231). Meanwhile, in the BMr adulterated PMr, permutation test using 8 components demonstrated the intersection value of Q2 of (0.0, −0.616) indicating model validity. The result of ROC test demonstrated the PLS-DA model validity supporting the permutation test. All samples were accurately classified in accordance with the result of misclassification test demonstrated by its AUC (area under the curve) of each class. The AUC value for each sample class obtained from both PLS-DA models was 1, exhibiting a good classification without misclassification [29].
Identification of discriminating metabolites
The identification of variables having important role in samples differentiation which associated to discriminating metabolites samples differentiation was performed using the VIP value. These discriminating metabolites were important as potential biomarker candidates to discriminate non-halal meats in beef. The variables having an important role in samples differentiation are shown by the VIP value more than 1.0. The discriminating metabolites from VIP analysis of beef-dog series are shown in Supplementary Table S1. Among those metabolites, 19 metabolites were found to increase with the increase of DMr levels in BMr (Table 1). Meanwhile, the discriminating metabolites from beef-pork series are listed in Supplementary Table S2. Further analysis showed that 28 metabolites were observed to increase with the increase of pork level in beef (Table 2). The discriminating metabolites were cross confirmed using the ANOVA analysis [24]. Metabolites with p<0.05 were significant metabolites, that increase with increasing dog meat and pork levels in beef, respectively. The discriminating metabolites that increased in line with the level of adulterants consisted of various metabolites classes such as amino acids, organic acids, fatty acids, and other lipids. These significant metabolites could be used as the keys to detect and monitor the presence of dog meat and pork, respectively.
On the other hand, the area of metabolites acetyl-L-carnitine, DL-carnitine, C12-carnitine, and C14-carnitine were found to be high in BMr and increased as the level of BMr increased in both series. Carnitine is derived from amino acids, and it is endogenously synthesized in the liver, kidney, and brain from the amino acids of methionine and lysine. Carnitine is reported to be high in beef and it plays an important role in turning fat into energy. In addition, it eliminates some toxic compounds by transporting them out of mitochondria [30]. From the above results, it can be summarized that the utilization of VIP analysis is very beneficial to analyze metabolomics data from untargeted LC-HRMS to obtain discriminating metabolites to discriminate beef from dog and pork meat adulteration.
Chemometrics of multivariate calibration
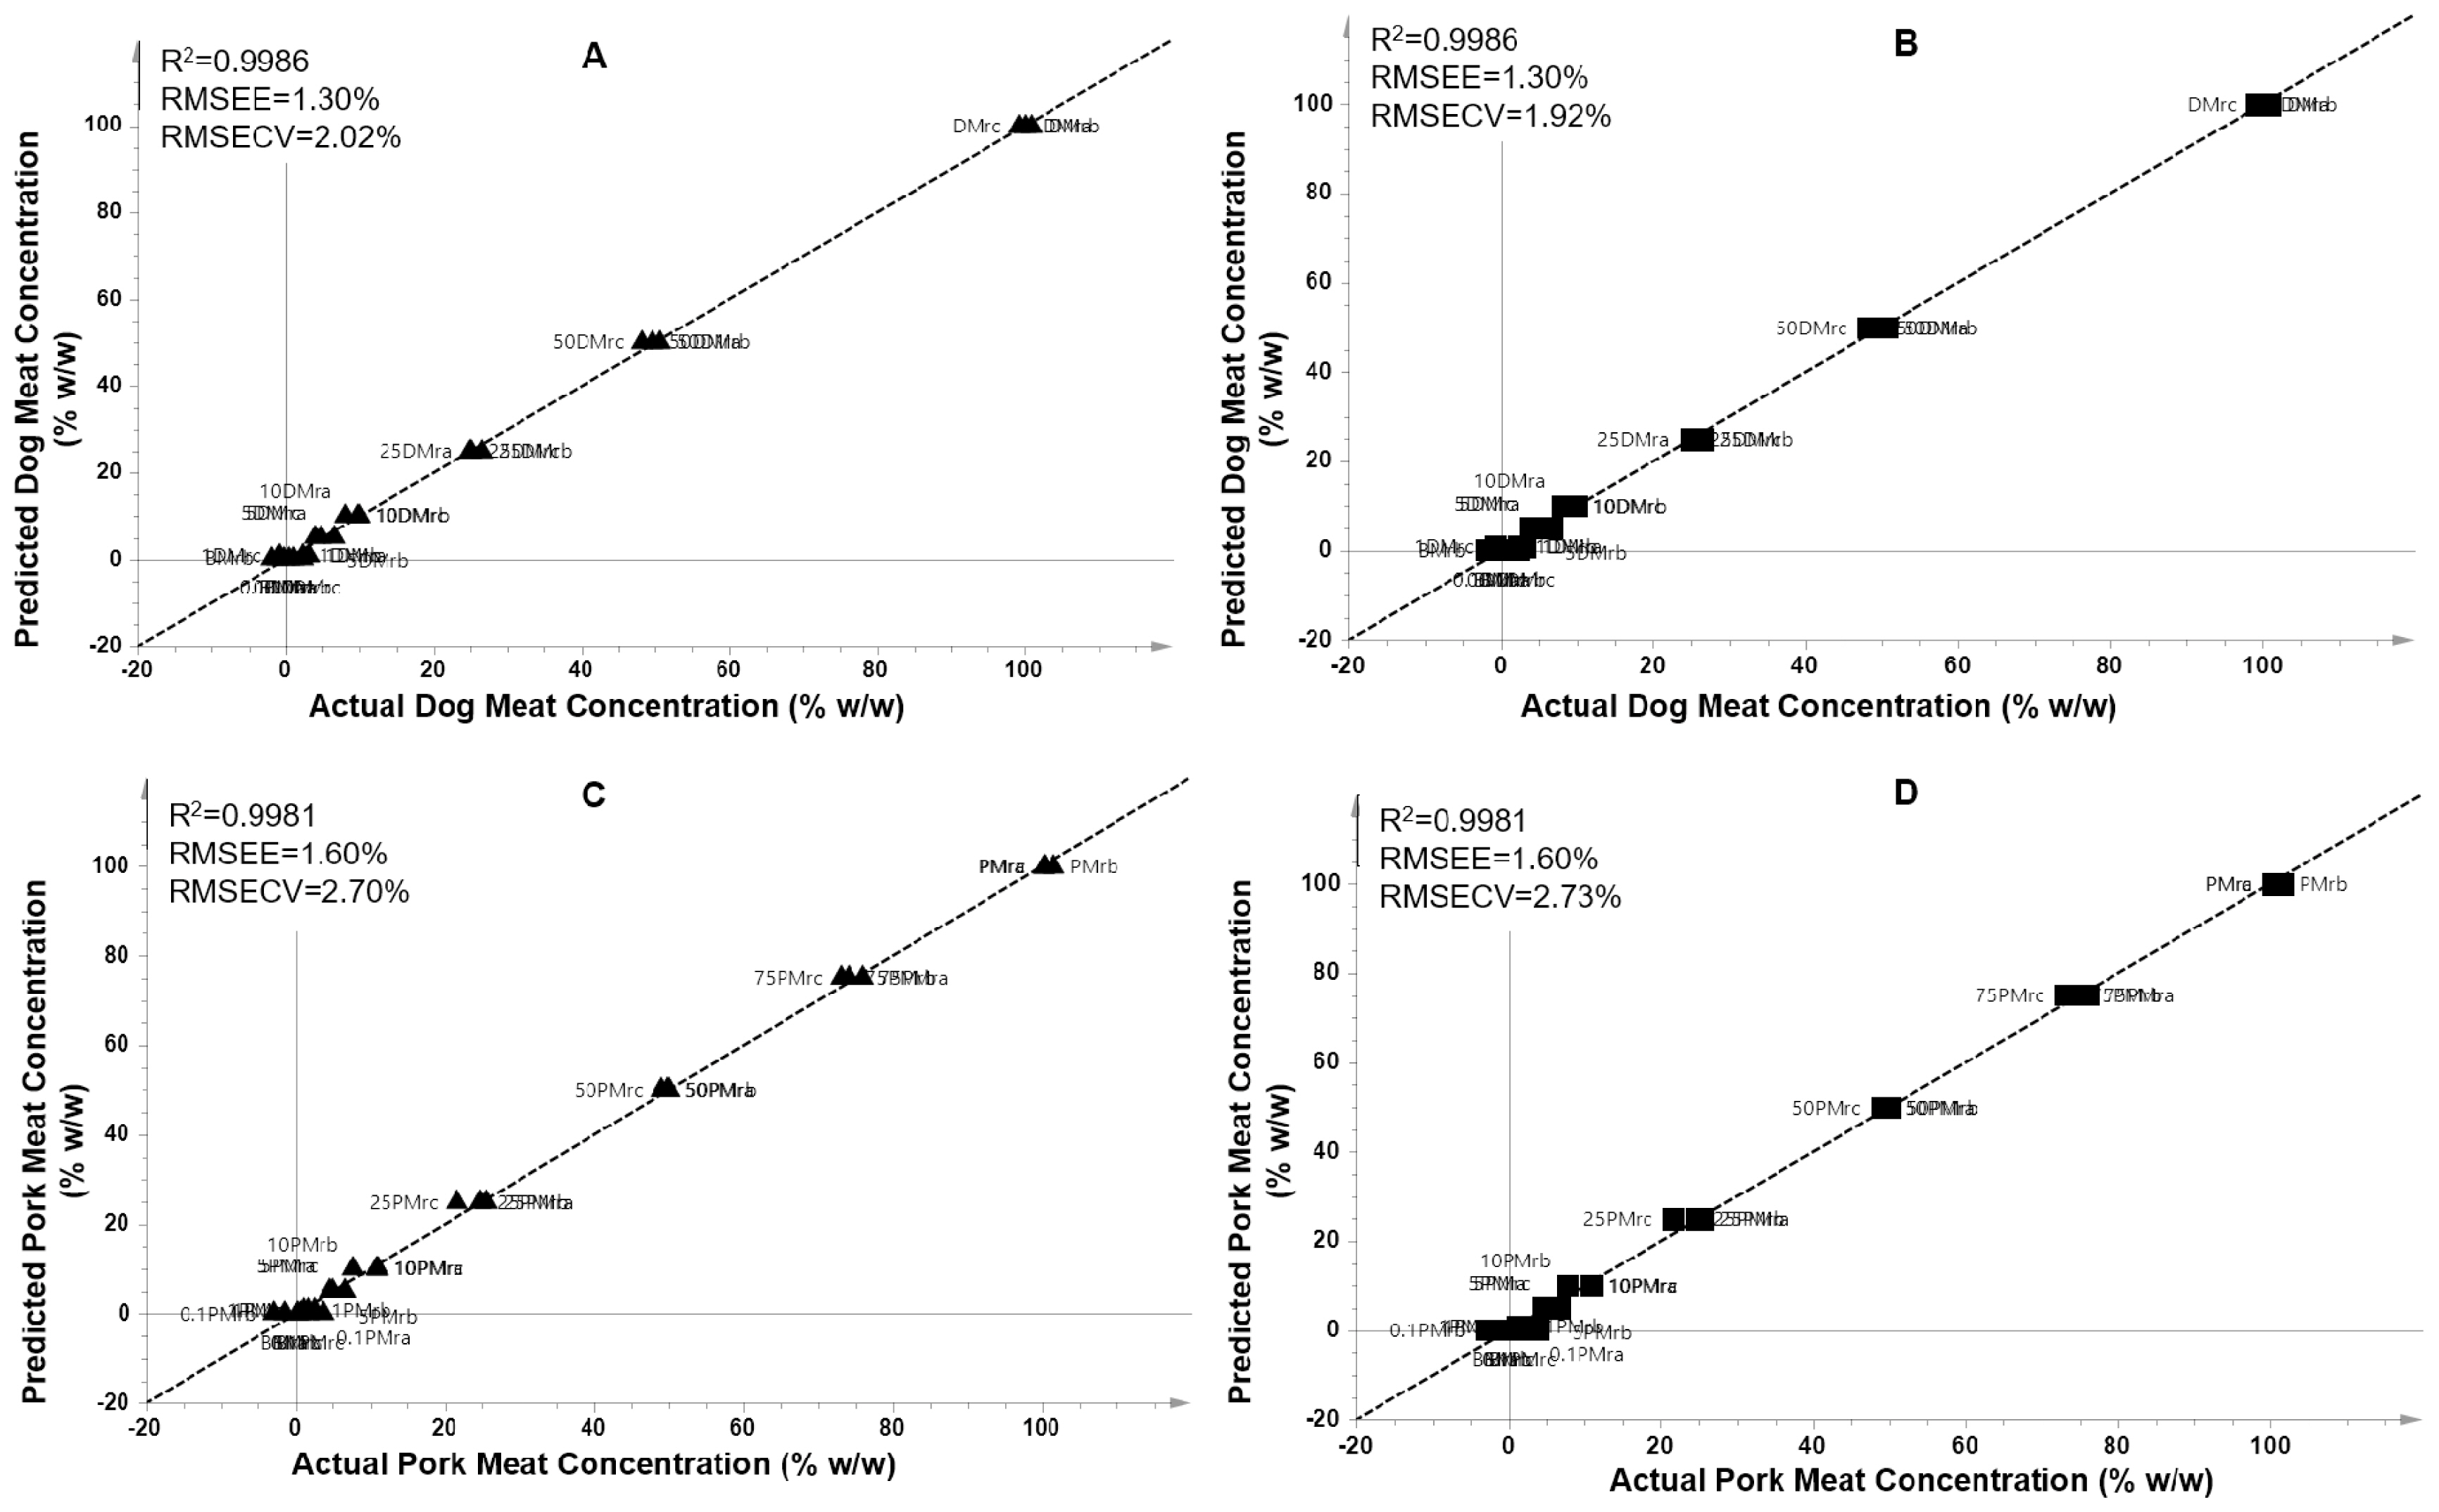
The metabolites obtained from VIP analysis (VIP>1.0) were subjected to multivariate regression analysis using PLS regression and OPLS regression. Partial least square was successfully used to accurately predict the levels of DMr and PMr in the adulterated beef (% w/w), respectively. A high correlation between actual values and predicted values of DMr in adulterated BMr was obtained (Figure 5A and 5C). The PLS model had a high R2 value (0.9986) which is associated to its high model accuracy. In addition, the model had a low value of RMSEE (1.30%) and RMSECV (2.02%), associating to low error and high precision of the PLS model. In addition, PLS also successfully predict the levels of PMr present in BMr with high accuracy and high precision. The model provided R2 = 0.9981 with RMSEE of 1.60% and RMSECV of 2.70%. On the other hand, the regression of orthogonal PLS (OPLS) has also been widely applied for predicting target of analytes employing the orthogonal components. In this study, OPLS model was successfully detect and predict the adulterants of DMr and PMr in BMr as exemplified in Figure 5B and 5D. The obtained R2 was 0.9986 and 0.9981 with RMSEE of 1.30% and 1.60% for beef-dog and beef-pork series, respectively. In addition, the RMSECV value was 1.92% and 2.73% for beef-dog meat and beef-pork series, respectively.
Analysis on the residual plot both in PLS and OPLS models showed that all the residuals value were randomly spread and located at the standard deviation values between −4 and +4. This result indicated that the residuals were normally distributed, and no outliers were detected. The results showed that both PLS and OPLS regression had a similar performance in predicting targets. The results of PLS and OPLS demonstrated that the discriminating metabolites obtained from VIP analysis were good predictors to build a prediction model to determine levels of dog and pork meat present as adulterants in beef meat. Therefore, PLS and OPLS regression could be used to support the results of VIP analysis in investigating the discriminating metabolites potential as biomarker candidates to differentiate non-halal meats adulteration in halal meats.
PLS-based regression become the most multivariate calibration techniques applied in various analysis to predict the concentration of targeted analytes in the presence of other substances or matrices, because it could be used for accurate prediction of the target. The use of LV to correlate X-matrix and Y-matrix in the regression analysis results in high predicting capacity. Some studies have successfully applied PLS for halal authentication by detection of lard in edible fats and detection of pork in meat and meat-based products using spectroscopic techniques [31]. The discriminating metabolites of pork have been successfully confirmed as good predictors for pork adulteration by PLS and OPLS [25]. Another research also successfully used PLS to verify the role of discriminating metabolites in tea with different storage times. Result reveled that the discriminating metabolites were good predictors of storage time [32]. In our study, the result showed that both PLS and OPLS was potential for accurate prediction of DMr and PMr as the adulterants in halal beef meat.
In metabolomics study, it should be noted that the complexity of metabolomics data and its interpretation is not an easy task. Several factors such as the difference in diets, origins, environmental factors, meat preparation, and storage could affect the metabolites. In this study, we found a panel of metabolites which strongly associated with the increasing levels of dog meat and pork adulteration in minced beef. However, further investigation on the effect of factors that might affect the metabolites is required for future research to verify the metabolites found.
CONCLUSION
The untargeted metabolomics approach using LC-HRMS combined with chemometrics could be an effective and powerful analytical technique for authentication of halal meats from non-halal meats adulteration. Further research using larger samples with various types of meats from different sources should be developed to warrant its reproducibility. Next, method standardization is required to obtain standard analytical method for halal testing of meats and meat-based food products.


 PDF Links
 PubReader
 ePub Link
 Full text via DOI
 Full text via PMC
 Download Citation
 Supplement1
 Print
Print


