


INTRODUCTION
Pigs are highly similar to humans in genetic and metabolic mechanisms. Therefore, the use of a pig as a model to study metabolism and obesity is significant [1]. The adipose tissue is the largest energy storage tissue in the body, and adipocytes can be derived from the differentiation of pluripotent mesenchymal stem cells [2]. Adipocyte differentiation is a process by which lipid droplets continuously accumulate in the cells, ultimately forming mature adipocytes [3]. The deposition of intramuscular fat (IMF) causes muscles to form marble patterns in meat, and IMF content is one of the important factors that affect the muscle quality. IMF is closely associated with muscle tenderness, meat colour and meat flavour [4]. Amino acids are not only the basic building blocks of proteins, but they can also be converted to lipids and carbohydrates. Numerous studies have also shown that amino acids play an important regulatory role in lipid metabolism [5].
The Mashen pig is an indigenous breed in the Shanxi province and characterised as an obese breed. By contrast, the Large White pig is considered as a lean breed. These two breeds show significant differences in lipid deposition, the IMF content of the Mashen pig was significantly higher than that of the Large White pig (p<0.01) [6]. In our previous studies, we showed that the levels of flavour amino acids, such as aspartate and glutamate, at the longissimus muscle of 6-month-old Mashen pigs were higher than those of Large White pigs. Glutamic-oxaloacetic transaminase (GOT) connects the two abovementioned amino acids. GOT was mainly found as cytoplasmic GOT and mitochondrial GOT, which were encoded by the GOT1 and GOT2 genes, respectively. RNA-seq results of the longissimus muscles from the 6-month-old Mashen and Large White pigs showed substantial differences in the expression levels of GOT1, malate dehydrogenase 1 (MDH1) and pyruvate dehydrogenase alpha 1 (PDHA1). Furthermore, these genes were enriched in the amino acid metabolic pathways. Through bioinformatics analysis, we found a key candidate gene, GOT1, which was significantly enriched in the leucine, aspartate and glutamate pathways [7].
GOT1 is a pyridoxal phosphate-dependent enzyme that participates in a reversible reaction in the cytoplasm where aspartate and α-ketoglutarate are used to synthesise glutamate and oxaloacetate [8]. This enzyme also has an important role in maintaining the cellular redox balance, promoting tumour cell proliferation and regulating amino acid metabolism [9]. Studies on colon cancer cell lines have found that overexpression of GOT1 caused cells to synthesize nicotinamide adenine dinucleotide phosphate (NADPH) to regulate the levels of reactive oxygen species and promote tumour growth. In addition, treating cells with aminooxyacetate to inhibit GOT1 could induce apoptosis in tumour cells, and targeting GOT1 could selectively kill tumour cells [10,11]. Knocking out the GOT1 gene can inhibit the glutamine metabolic pathway and decrease the NADPH synthesis, thereby inhibiting cell proliferation [12]. Studies on GOT1 have mainly focused on tumours, and only a few studies have investigated the participation of GOT1 in lipid synthesis.
In this study, we attempted to determine the role of GOT1 in adipocyte differentiation. We constructed porcine GOT1 gene knockout and overexpression vectors and transfected these vectors into 3T3-L1 cells. We used quantitative reverse-transcription polymerase chain reaction (qRT-PCR), Western blot and oil red-O staining (ORO) to investigate the effects of the GOT1 gene on the adipogenesis in the 3T3-L1 cells and examine the effector mechanisms of the GOT1 gene in adipocyte differentiation.
MATERIALS AND METHODS
Experimental animals and sample collection
The six 6-month-old Mashen pigs and six Large White pigs used in this experiment were obtained from the Datong pig farm and housed under the same conditions. All animal procedures were performed in strict accordance with the Code of Ethics of the World Medical Association (http://ec.europa.eu/environment/chemicals/lab_animals/legislation_en.htm). Experimental protocols were approved by the Animal Ethics Committee of Shanxi Agricultural University (Shanxi, China). The number of Ethics Committee agreement is SXAU-EAW-P002003. Pigs were euthanised according to standard slaughtering procedures. After slaughter, the heart, liver, subcutaneous fat at the back, spleen, kidneys, small intestine, cerebellum, longissimus muscle, psoas major muscles and biceps femoris muscles were collected and snapped frozen in liquid nitrogen before they were transferred to a freezer at −80°C for storage.
Materials
The restriction endonuclease BsmB I and T4 DNA ligase were purchased from NEB, Inc. (Ipswich, MA, USA). The gel recovery kit, PrimeScript RT reagent Kit with gDNA Eraser reverse transcription kit, SYBR Premix ExTaq RT-PCR kit and competent cells were purchased from TaKaRa Bio Japan, Inc. (Tokyo, Japan). The plasmid isolation kit was purchased from Omega Bio-tek, Inc. (Norcross, GA, USA). Rabbit GOT1 primary antibodies (bs-3977R), rabbit MDH1 primary antibodies (bs-3996R) and rabbit β-actin primary antibodies (bs-0061R) were purchased from Bioss, Inc. (Woburn, MA, USA). Goat anti-rabbit fluorescent secondary antibodies were purchased from LI-COR Biosciences, Inc. (Lincoln, NE, USA). Penicillin–streptomycin and NADP/NADPH assay kits were purchased from Solarbio Science & Technology Co., Ltd. (Beijing, China). Low-glucose Dulbecco’s modified eagle medium (DMEM) and foetal bovine serum (FBS) were purchased from Gibco, Inc. (San Diego, CA, USA).
sgRNA design and synthesis
The cDNA for porcine GOT1 (Genbank accession no: NM_213927.1) was inputted into the website http://crispr.dbcls.jp/ for the sgRNA design. Three sgRNA sequences with high score and specificity were designated as sg1, sg2, and sg3 (Table 1). A BsmB I site was added at the 5′ end. All sgRNA sequences were synthesised by Sangon Biotech Co., Ltd. (Shanghai, China).
Construction and identification of the Cas9-GOT1 knockout vector
Diluted sgRNA (10 μmoL/L) was annealed based on the annealing program (93°C for 5 min, followed by a 1°C decrease every min to 25°C for a total of 68 cycles). The annealing solution was 2 μL of 10×buffer, 2 μL each of the upstream and downstream primers for sgRNA and ddH2O, which was added for a final volume of 20 μL. To cleave the Cas9 vector backbone, BsmB I cleavage was carried out according to the following conditions: at 55°C for 2 h and then at 80°C for 10 min. The enzyme cleavage solution was 1 μL of 10×buffer, 500 ng of plasmid DNA, 1 μL of BsmB I (10,000 U/mL) and ddH2O, which was added for a final volume of 10 μL. T4 ligase was used to ligate the cleaved Cas9 vector and the annealed sgRNA sequence to construct the Cas9-GOT1 knockout vector. The ligated product was transformed into DH5α competent cells, and the plasmids were extracted for sequencing and identification. Recombinant plasmids that were confirmed to be successful by sequencing were designated as GOT1_KO1, GOT1_KO2, and GOT1_KO3. Endotoxin-free plasmid extraction kits were used to extract the three plasmids for use in subsequent experiments.
Detection of the knockout efficiency of the Cas9-GOT1 vector
PK15 cells were subcultured onto a 10 cm culture dish and cultured with low-glucose DMEM containing 10% FBS and 1% penicillin–streptomycin at 37°C and 5% CO2. An electroporator from Lonza (Cologne, Germany) was employed for transfection. When cells grew to 70% to 80% confluence, 0.25% trypsin solution was used for digestion at 37°C. A total of 4×10⁵ cells were diluted to 100 μL of electroporation solution, and 2 μg of the above plasmid was added. Then, electroporation was carried out based on the program (DS-130) provided by Lonza (Germany). After 12 h of transfection, the cells were observed under a fluorescence microscope (Leica, Germany), and the transfection efficiency was determined. Cells that were transfected with empty plasmids were set as the negative control group, whereas those transfected with GOT1_KO1, GOT1_KO2, and GOT1_KO3 recombinant plasmids were set as the knockout groups. After 1 week of screening with puromycin (1 μg/mL), the culture medium was changed, and proteins were extracted after the cells were confluent. Western blot analysis was then used to measure the effects of GOT1 gene knockout.
Construction and identification of the over-GOT1 expression vector
The total RNA was extracted from porcine muscle tissues and reverse transcribed into cDNA. Upstream and downstream primers were designed based on the GOT1 cDNA (Genbank Accession No. NM_213927.1): forward primer: F1: 5′-CCCAAGCTTGCCACCATGGCACCTCCATCA GTCTTTGCCG-3′ (Hind III site was underlined, and the red loci were enhancers), and reverse primer: R1: 5′-CCG GAATTCTCACTGGATTTTGGTGACAGCTTCA-3′ (EcoR I site was underlined) were used to amplify the full-length coding sequences (CDS). Then, a gel recovery kit was used for purification.
Hind III and EcoR I enzymes were used to cleave the purified products and the empty pCDNA-3.1-EGFP vector. Then, T4 ligase was used to ligate the cleaved purified product and the pCDNA-3.1-EGFP vector to finally obtain the GOT1 overexpression vector, pCDNA-3.1-EGFP-GOT1. The ligation product was transformed into DH5α competent cells. Endotoxin-free plasmid extraction kits were used to extract the plasmids, which were used for subsequent experiments after the sequences were verified.
Transfection and induced differentiation of the 3T3-L1 cells
When the 3T3-L1 cells had grown to 70% to 80% confluence, 0.25% trypsin solution was used for digestion at 37°C. A total of 4×10⁵ cells were diluted in 100 μL of the electroporation solution, and 2 μg of the above plasmid were added. Then, electroporation was performed based on the program (CM-137) provided by Lonza (Germany). After 12 h of transfection, the cells were observed under a fluorescence microscope, and the transfection efficiency was determined. Cells transfected with the empty pCDNA-3.1-EGFP vector were set as the overexpression negative control group (control), whereas the cells transfected with the pCDNA-3.1-EGFP-GOT1 overexpression vector were set as the overexpression group (Over-GOT1). Cells transfected with the empty Cas9 vector were set as the knockout negative control group, whereas cells transfected with GOT1_KO3 plasmid were set as the knockout group. G418 (250 μg/mL) was used to screen the overexpression vector, whereas puromycin (1 μg/mL) was used to screen the knockout vector. After 1 week of screening, the medium was changed to a normal culture medium (low-glucose DMEM + 10% FBS + 1% penicillin–streptomycin). Differentiation was induced after the cells were confluent.
The methods used to induce differentiation of the 3T3-L1 cells in the control and test groups were the same. Differentiation culture medium (high-glucose DMEM + 10% FBS + 1% penicillin-streptomycin + 5 μg/mL insulin + 1 μM dexamethasone + 0.5 mM IBMX) was used for cell culture and changed once every 2 days. After 4 days, the medium was changed to the differentiation maintenance medium (low-glucose DMEM + 10% FBS + 1% penicillin-streptomycin + 5 μg/mL insulin) and changed once every 2 days. The cells were used for subsequent experiments after 8 days of differentiation.
Oil red-O staining
The ORO staining was employed to examine the 3T3-L1 adipocyte differentiation. Cells that underwent differentiation for 8 days were washed twice with phosphate-buffered saline (PBS) before they were fixed with formaldehyde (10%) for 10 min. The cells were then washed again with PBS and stained with freshly diluted ORO for 15 min. After staining, the cells were washed with PBS and photographed using a microscope (Leica, Germany).
Quantitative reverse-transcription polymerase chain reaction
Total RNA was extracted from the cells and then reverse transcribed into cDNA. The relative expression of GOT1, MDH1, and adipogenesis-related genes, peroxisome proliferator activated receptor gamma (PPARγ) and fatty acid binding protein 4 (FABP4, also known as ap2), were measured in the different groups. 18S was used as an internal reference gene. The 10 μL reaction solution consisted of 5 μL of SYBR, 0.2 μL of Rox, 0.15 μL of each upstream and downstream primers, 2 μL of cDNA, and 2.5 μL of ddH2O. The reaction conditions were as follows: predenaturation at 95°C for 20 s, followed by 36 cycles of denaturation at 95°C for 20 s, and annealing and extension at 60°C for 20 s. The results were calculated using the 2−ΔΔCT method. Table 2 shows the primer sequences.
Western blot
The total protein was extracted from the cells in the knockout, overexpression and corresponding control groups. Then, 20 μg of the protein from each group were loaded onto an sodium dodecyl sulfate-polyacrylamide gel before gel electrophoresis was performed. The proteins were transferred to a membrane, blocked and incubated with primary and secondary antibodies. The LICOR imager was used to develop the membranes, and the imager software Image Studio was used to calculate the optical density of the bands.
Measurement of NADPH levels in cells
The NADP/NADPH ratio assay kit was used to measure NADPH levels in cells. After cells were washed thrice with PBS, the NADP/NADPH extraction buffer was added, and the cells were incubated on ice for 20 min, followed by incubation at room temperature for 10 min. The supernatants were collected, and the absorbance was measured at 590 nm. The NADP/NADPH ratio was used to reflect the relative level of NADPH.
RESULTS
Construction and screening of GOT1 knockout vectors
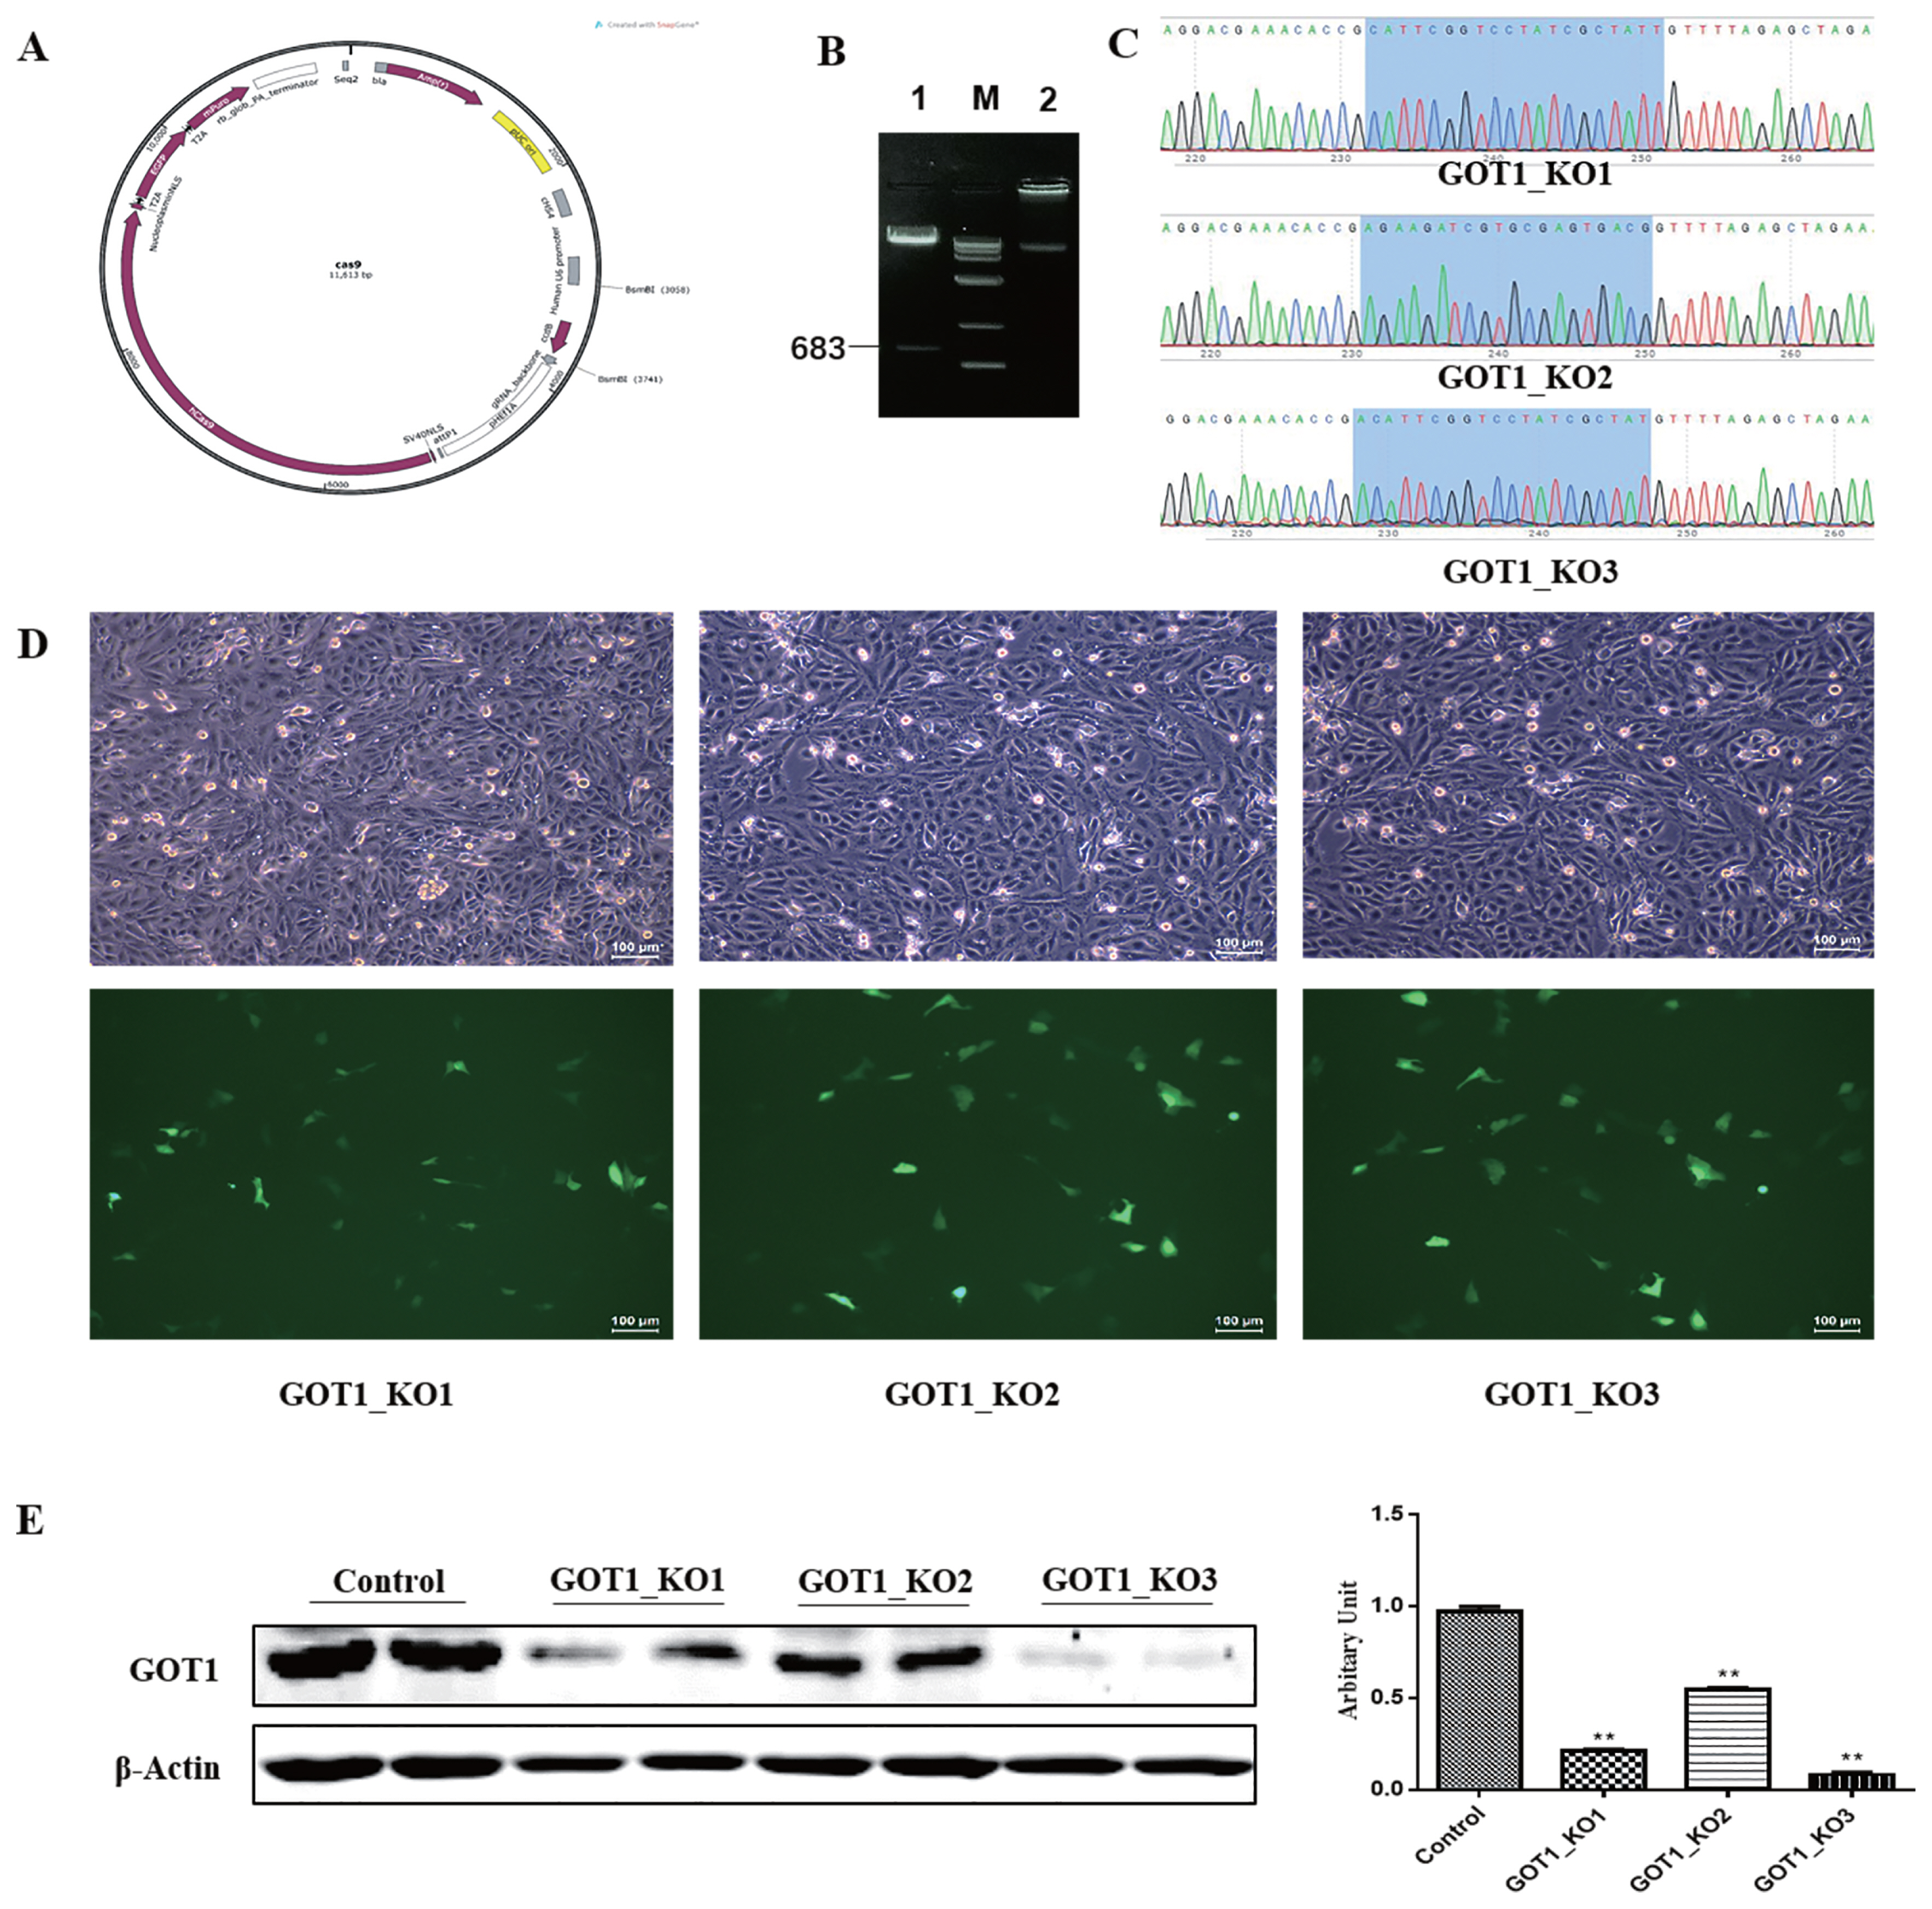
The synthesised sgRNA sequences underwent annealing before ligation with the BsmB I-linearised Cas9 plasmid (Figure 1A, B). The ligation product was transformed into competent cells. After plating, culture and isolation of single colonies, the plasmids were extracted for sequencing and identification. The results showed that the three recombinant plasmids were successfully constructed (Figure 1C). Green fluorescence could be observed for the negative control and knockout groups under a fluorescence microscope. The transfection efficiency of the PK15 cells was 20% to 30%, indicating that the plasmid transfection was successful (Figure 1D). Puromycin (1 μg/mL) was used to treat the cells for 1 week. After the cells became confluent, the cells were cultured for another 48 h before collection. The total protein was collected from the cells from the different groups for Western blot analysis. The results showed that, compared with the control group, the protein expression levels in the GOT1_KO1, GOT1_KO2, and GOT1_KO3 groups were significantly decreased (p<0.01), and the reduction of GOT1 in the GOT1_KO3 group was the most significant (Figure 1E). This result indicated that the knockout effects of GOT1_KO3 were the most efficient.
Construction and identification of the GOT1 overexpression vector
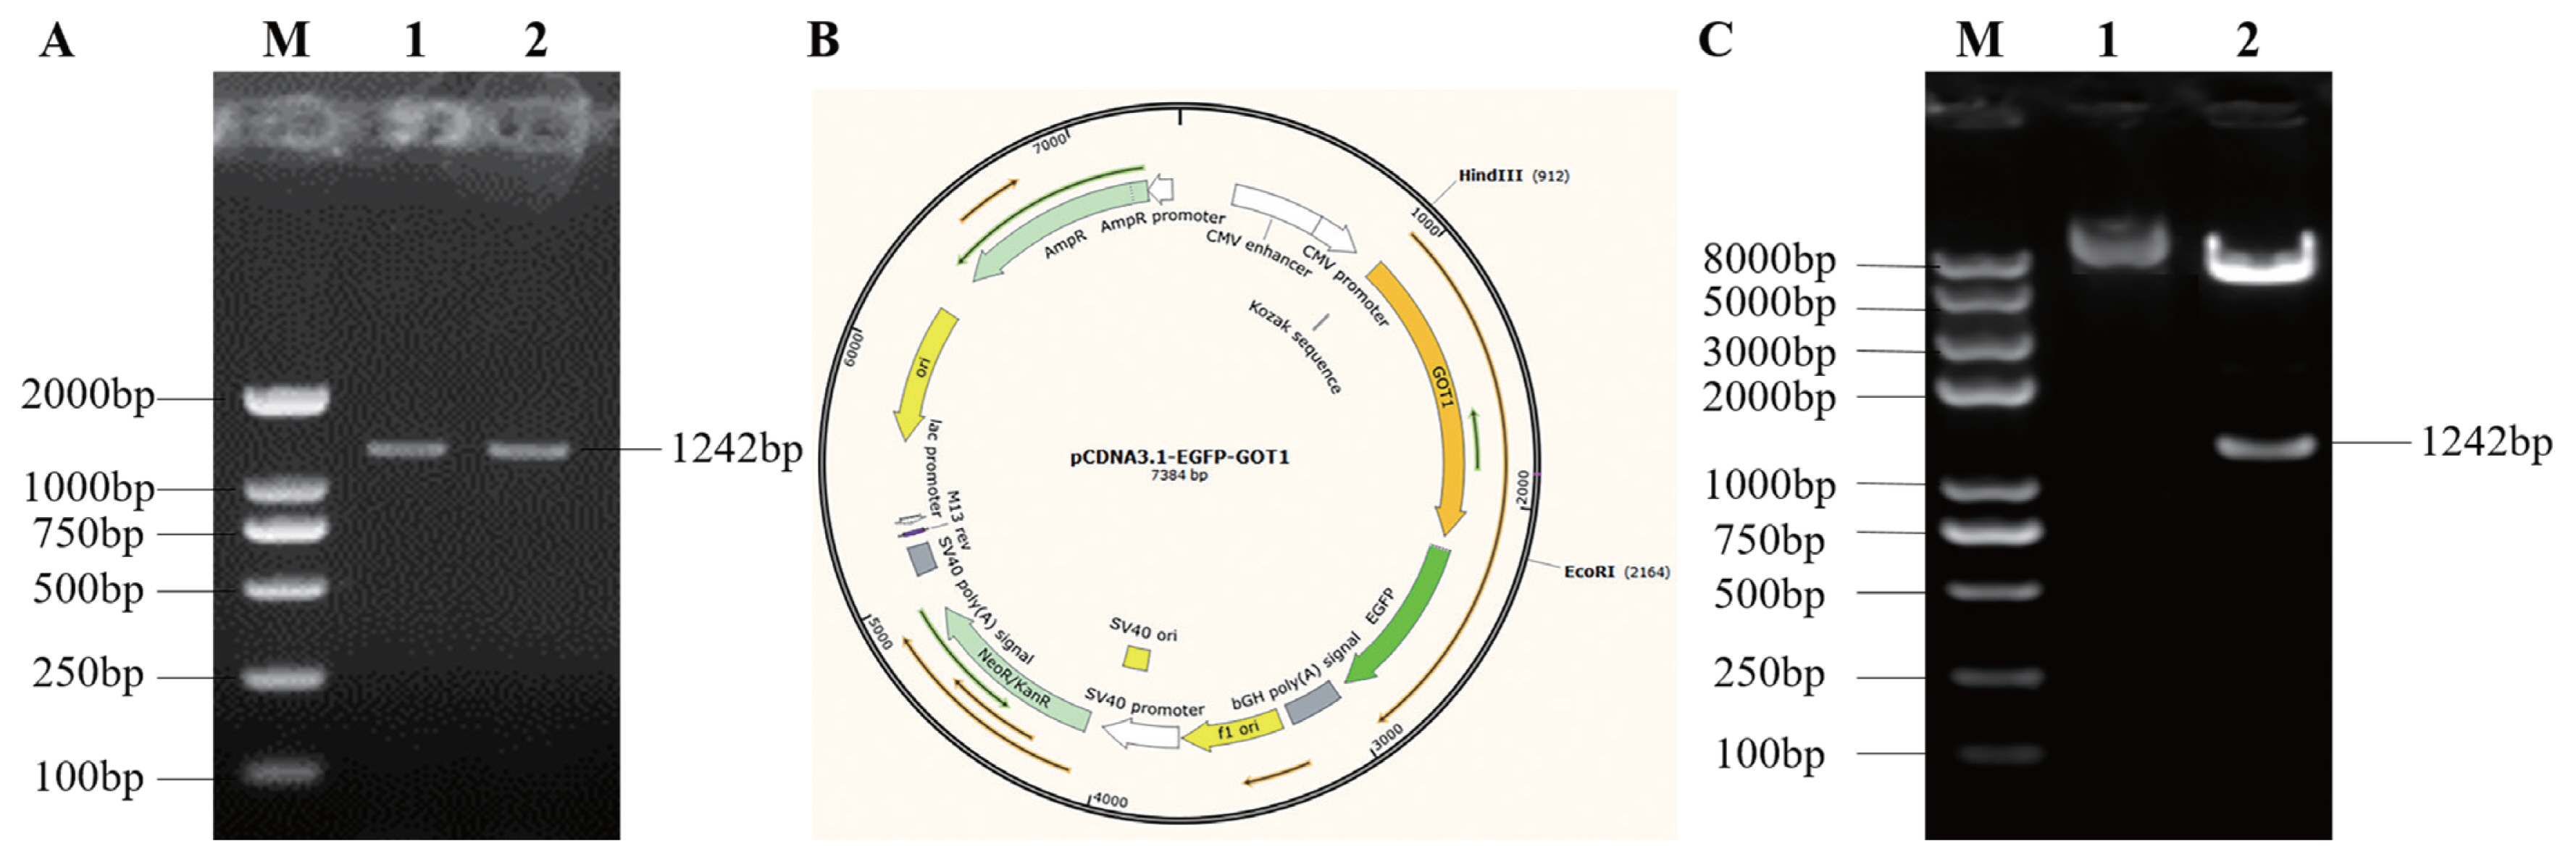
The amplified porcine GOT1 gene CDS (Figure 2A) was ligated to an empty pCDNA-3.1-EGFP plasmid to obtain the pCDNA-3.1-EGFP-GOT1 recombinant plasmid (Figure 2B). The ligation product was transformed into competent cells. After plating, culture and isolation of the single colonies, plasmids were extracted for sequencing and identification. The results showed that the GOT1 overexpression plasmid was successfully constructed. Then, Hind III and EcoR I were used to cleave the successfully sequenced plasmid and a band of the same size as the PCR product was obtained. This result also showed that the GOT1 overexpression plasmid was successfully constructed (Figure 2C) and could be used for transfection experiments.
Effects of GOT1 knockout and overexpression on adipocyte differentiation
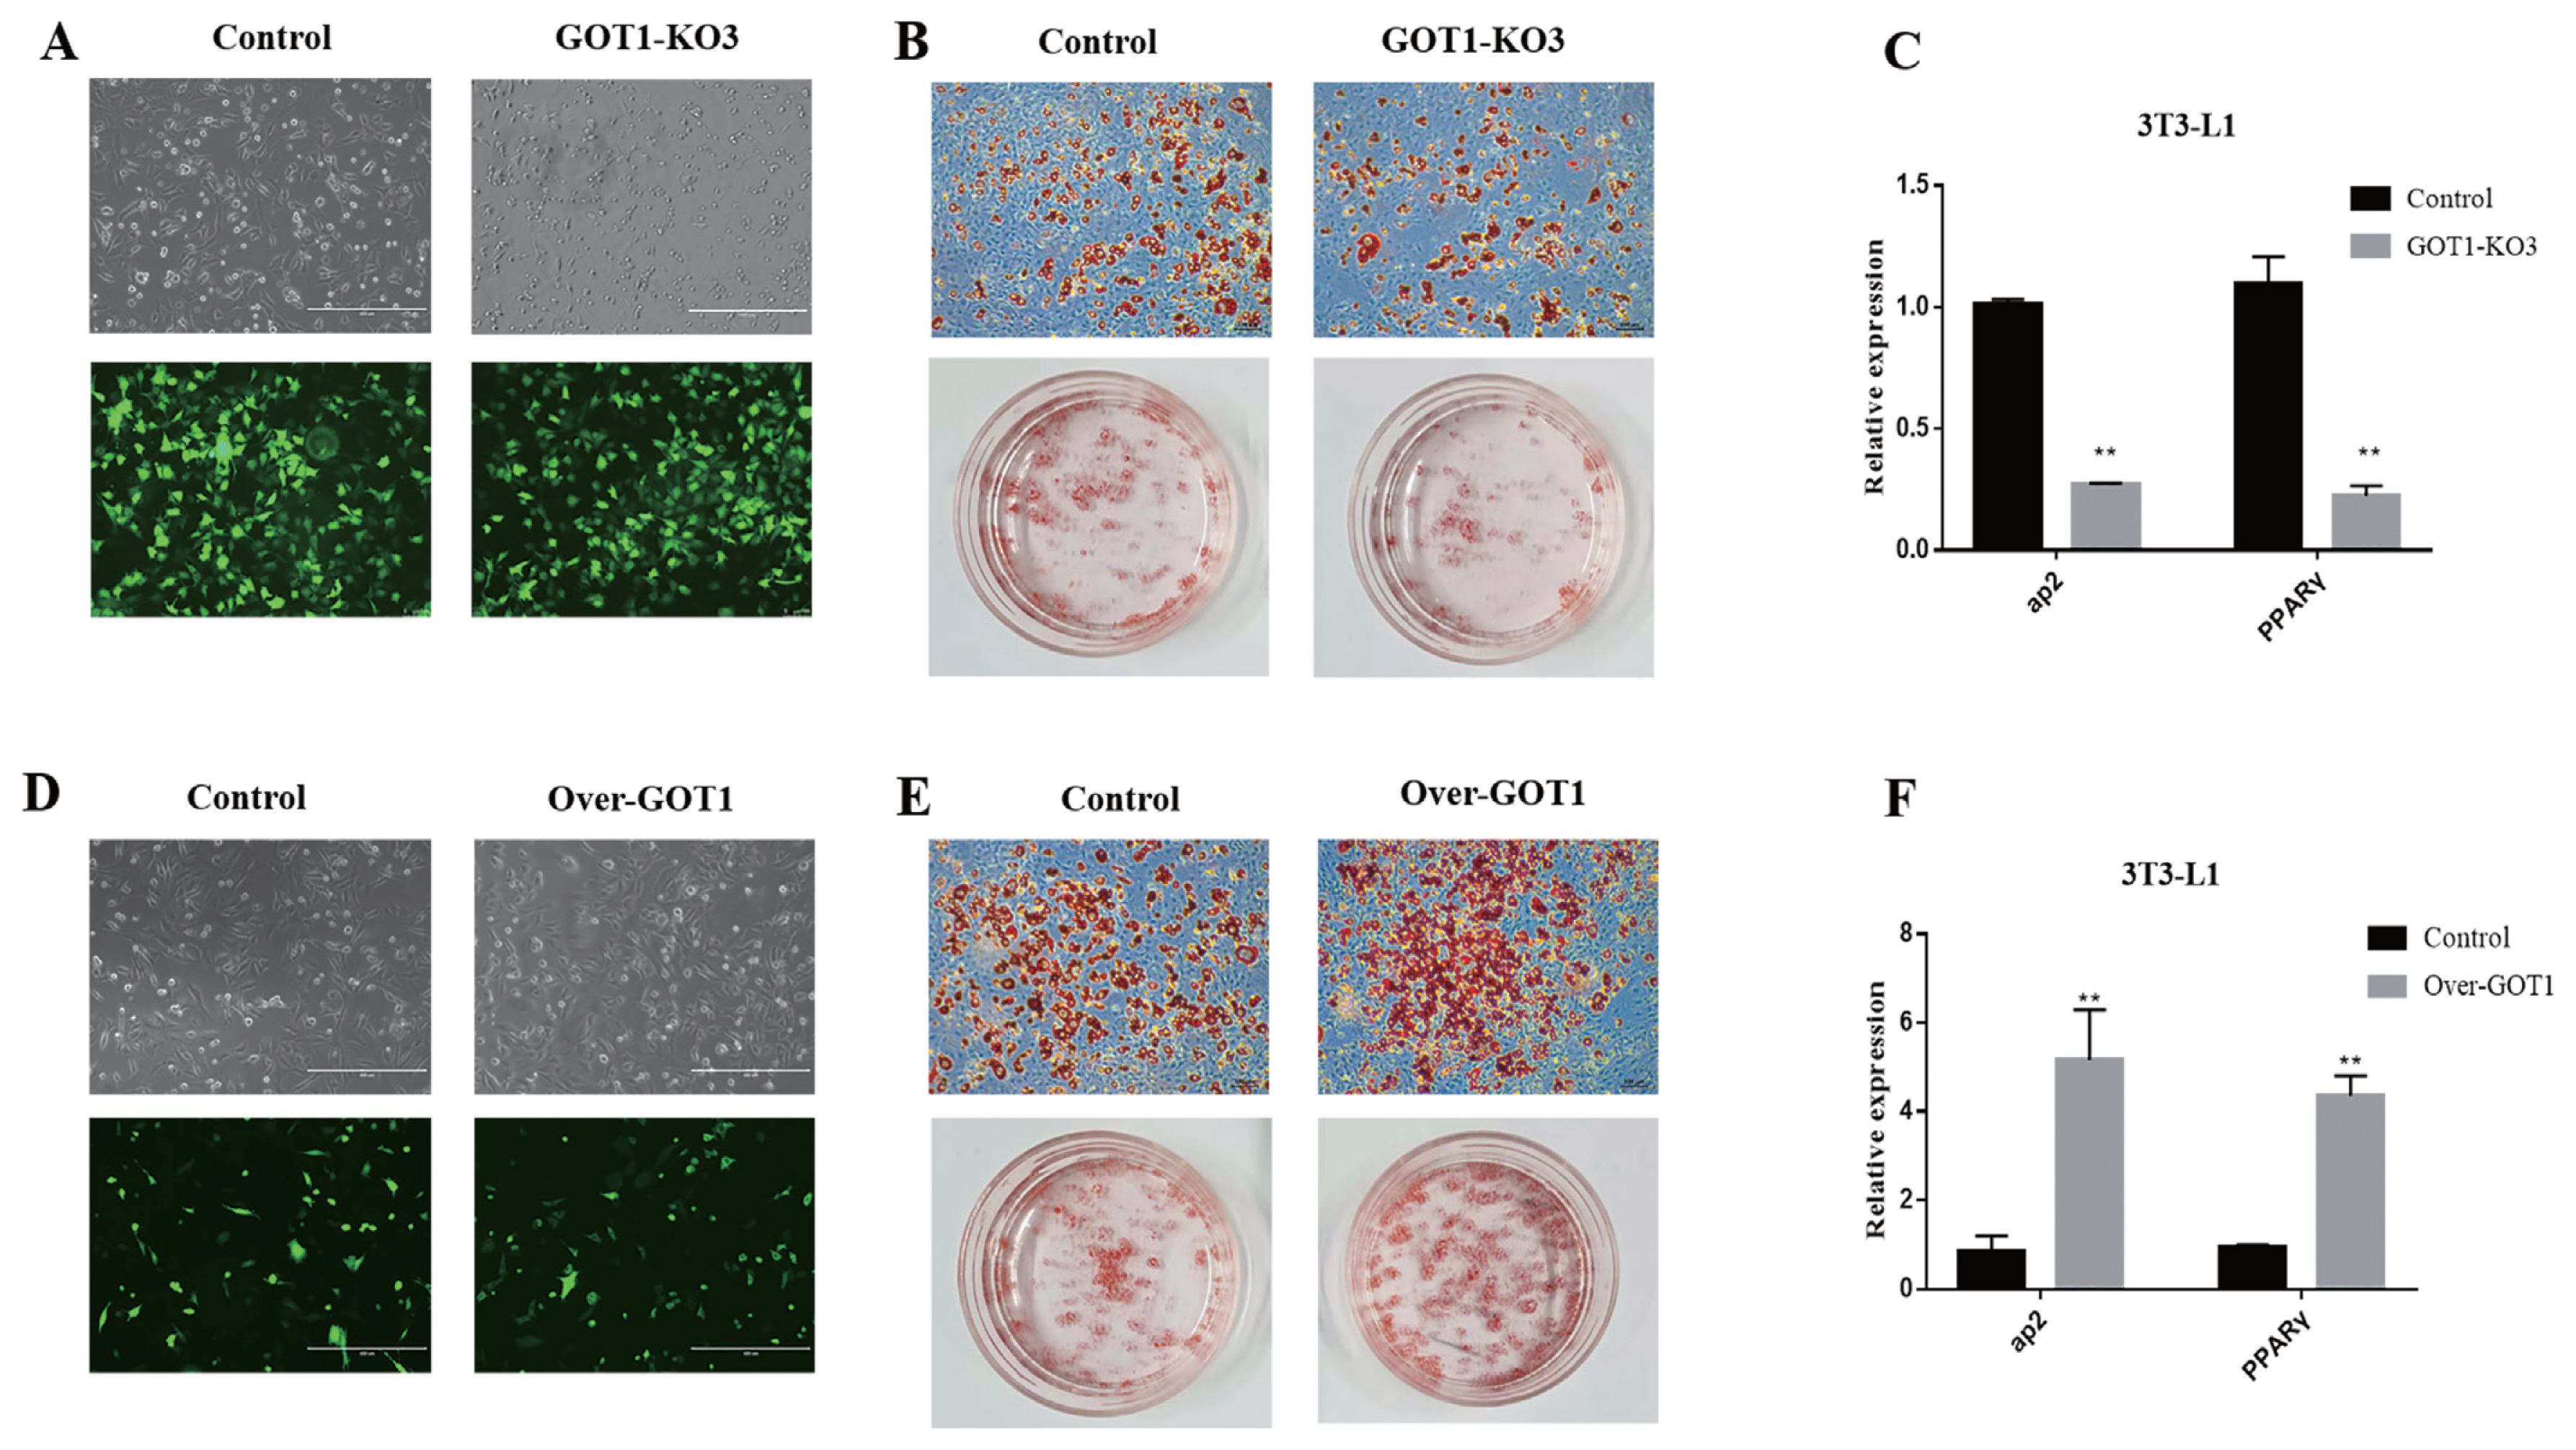
The Cas9 empty plasmid and the knockout plasmid GOT1_KO3 were transfected into the 3T3-L1 cells, and cells were observed after 12 h. Green fluorescence could be observed for the knockout and the negative control groups under a fluorescence microscope. The transfection efficiency was high, showing that plasmid transfection was successful (Figure 3A). Puromycin (1 μg/mL) was used to treat the cells for 1 week. Differentiation was induced after the cells became confluent. After the 3T3-L1 preadipocytes were differentiated (8 days), ORO staining was used to assess the status of lipid accumulation. The results showed a significantly lower lipid accumulation in the cells from the GOT1 knockout group (Figure 3B). RNA was extracted from the cells of each group for qRT-PCR. The results showed that the mRNA expression levels of aP2 and PPARγ were also significantly decreased (p<0.01) (Figure 3C).
The empty overexpression vector and GOT1 overexpression vector were transfected into the 3T3-L1 cells, and the cells were observed after 12 h. Green fluorescence could be observed for both the overexpression group and the negative control group under a fluorescence microscope. The transfection efficiency was high, showing that the plasmid transfection was successful (Figure 3D). G418 (250 μg/mL) was used to treat the cells for 1 week, and differentiation was induced after the cells were confluent. After differentiation was induced in the cells (8 days), ORO staining was performed. The results showed that lipid accumulation was significantly increased in the cells overexpressing GOT1 (Figure 3E). The mRNA expression levels of aP2 and PPARγ were also significantly increased (p<0.01) (Figure 3F).
GOT1 regulation of the adipose cell differentiation by changing the NADPH content
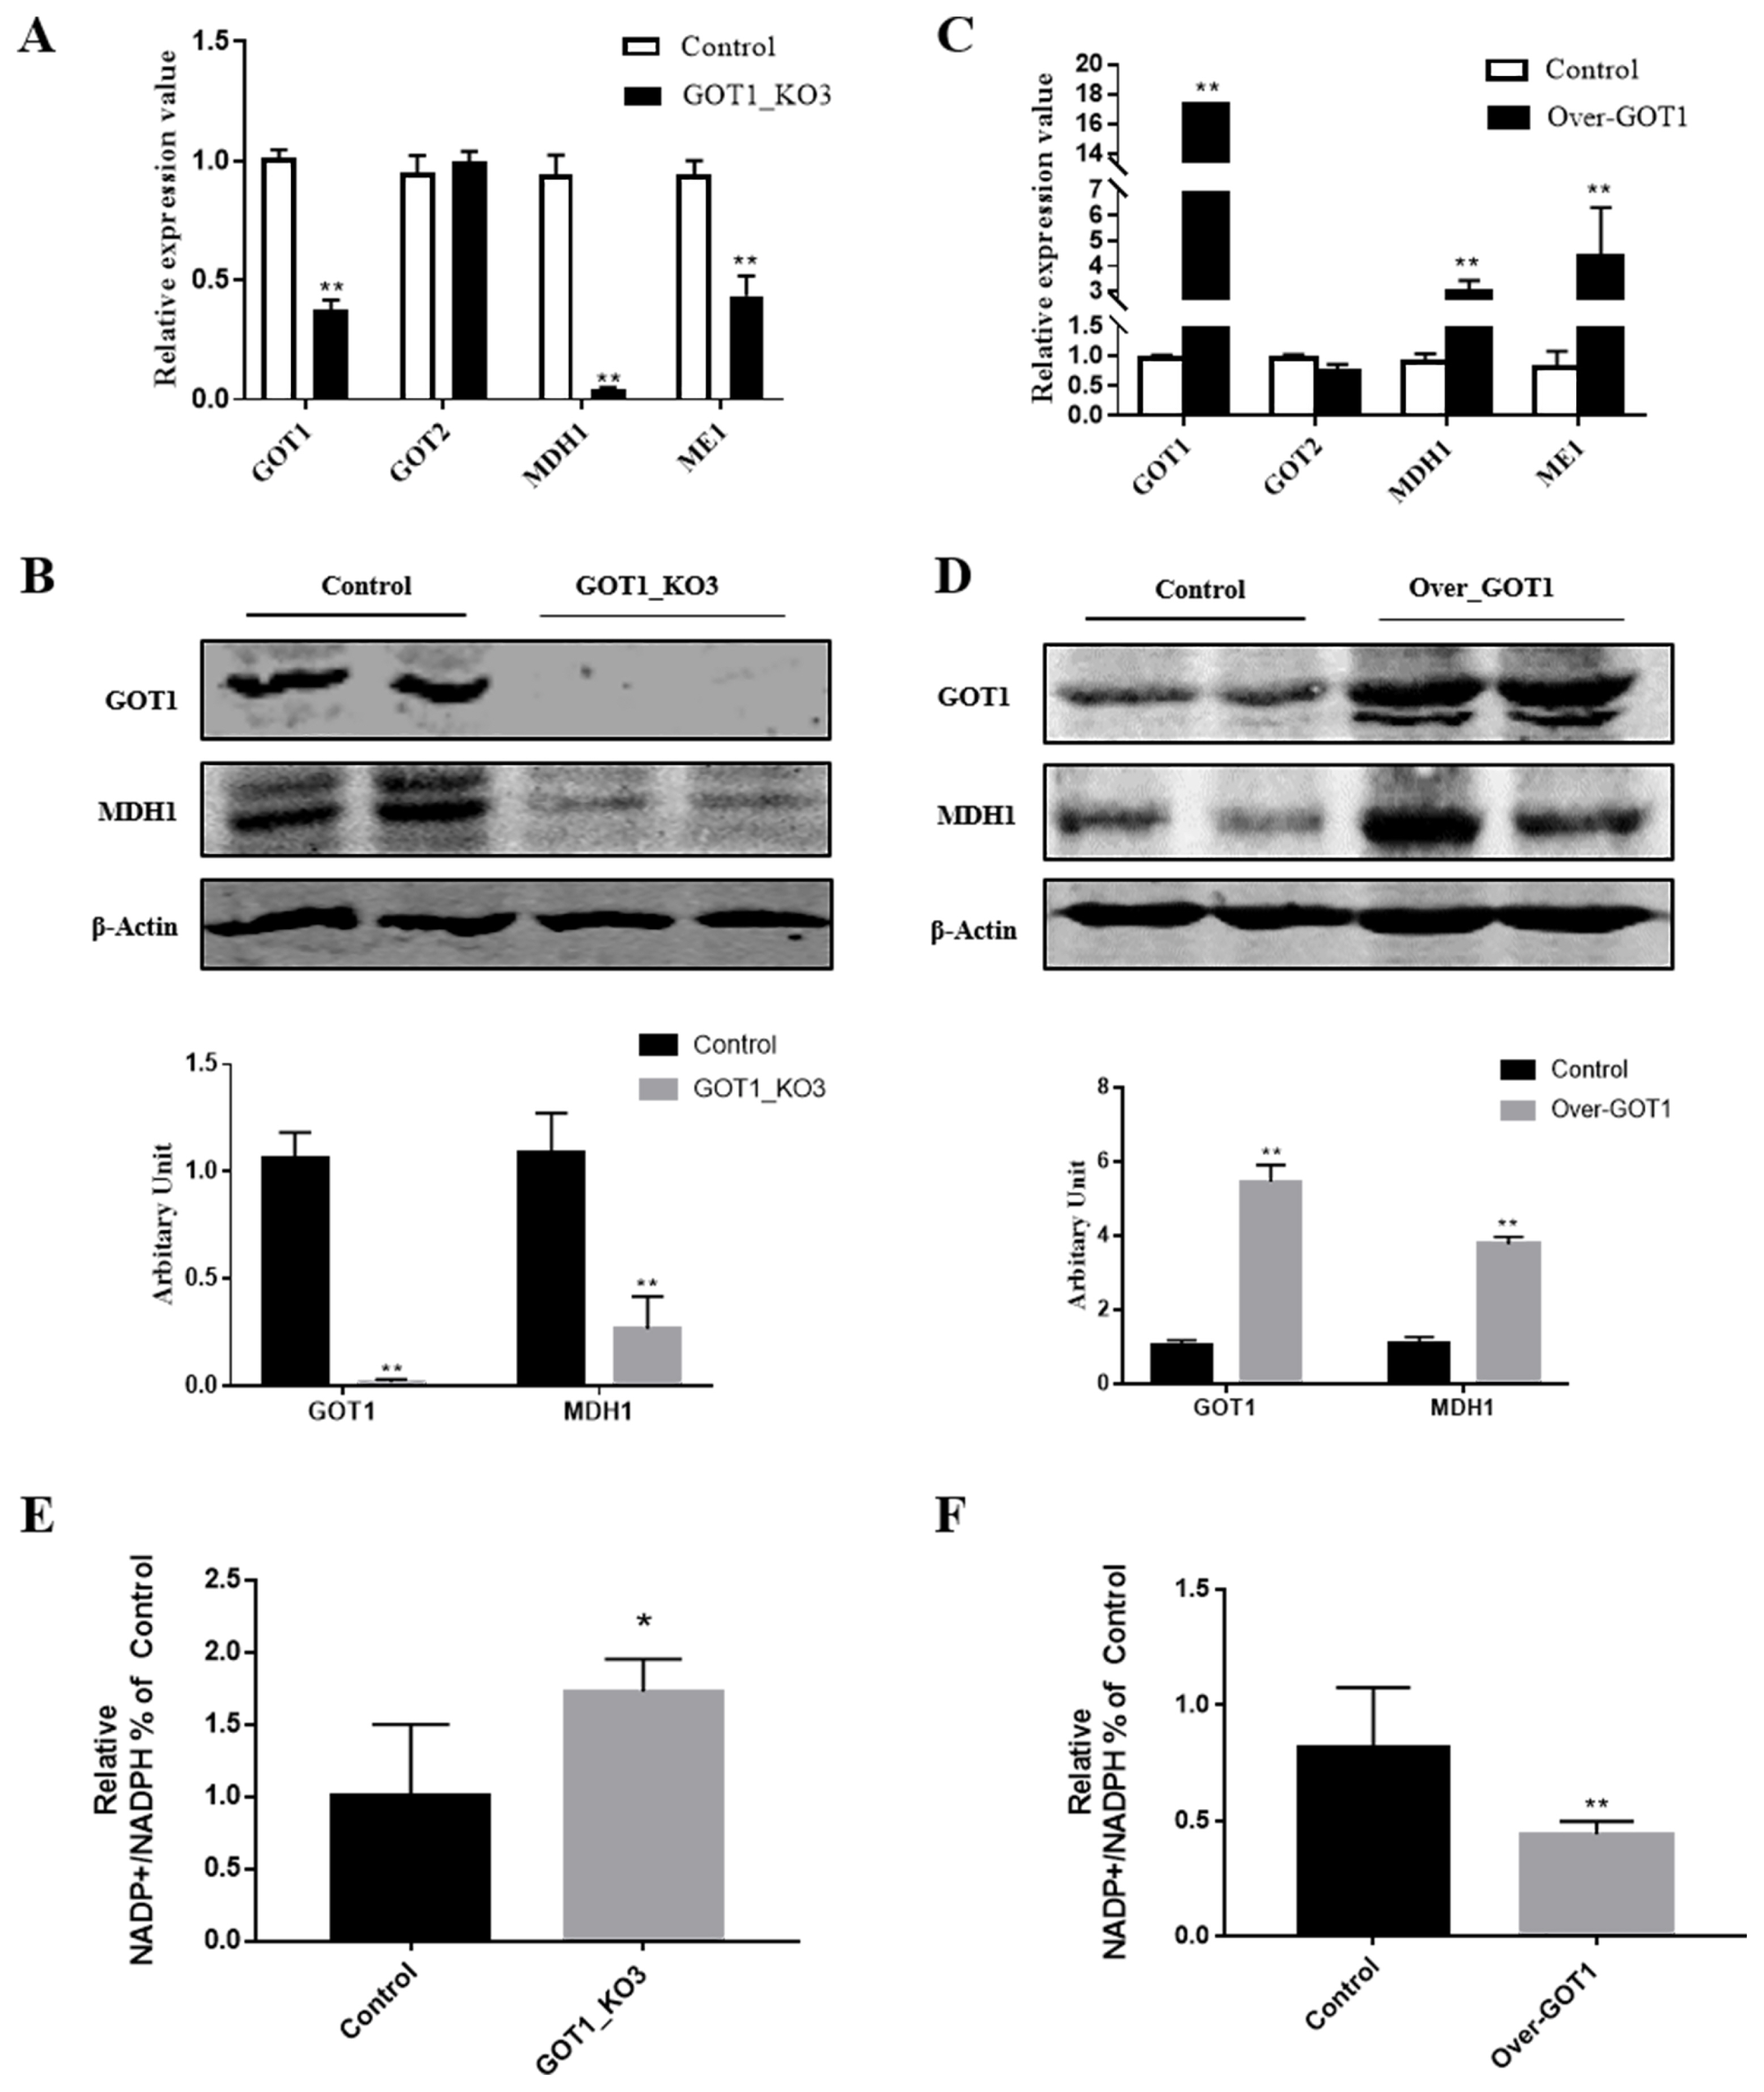
Aspartate undergoes catalysis by GOT1 in the cytoplasm to become oxaloacetate, which then undergoes MDH1 catalysis to form malate. The NADPH that participates in the catalysis of fatty acid synthesis is synthesised by the malic enzyme (ME1), which catalyses the reaction with malate. After knocking out GOT1, we measured the mRNA and protein expression levels of MDH1 and found that they were significantly decreased (p<0.01) (Figure 4A, B). By contrast, overexpressing GOT1 led to a significant increase in the mRNA and protein expression levels of MDH1 (p<0.01) (Figure 4C, D). Considering that the GOT1 gene is homologous to GOT2, we also measured the expression of the GOT2 gene but did not observe any changes (Figure 4A, C). We speculate that this phenomenon may be because the regulation of lipid synthesis mainly occurred in the cytoplasm, whereas GOT2 mainly carried out its function in the mitochondrial matrix. Therefore, the expression levels of GOT2 did not change. After knocking out GOT1, the NADPH content in the cells significantly increased (p<0.01) (Figure 4E). Conversely, GOT1 overexpression caused the NADPH content to notably decrease (p<0.01) (Figure 4F). Combining this result with the MDH1 expression status, this experiment demonstrated that GOT1 regulated adipocyte differentiation by changing the NADPH content.
Characteristics of GOT1 expression in the Mashen and Large White pigs
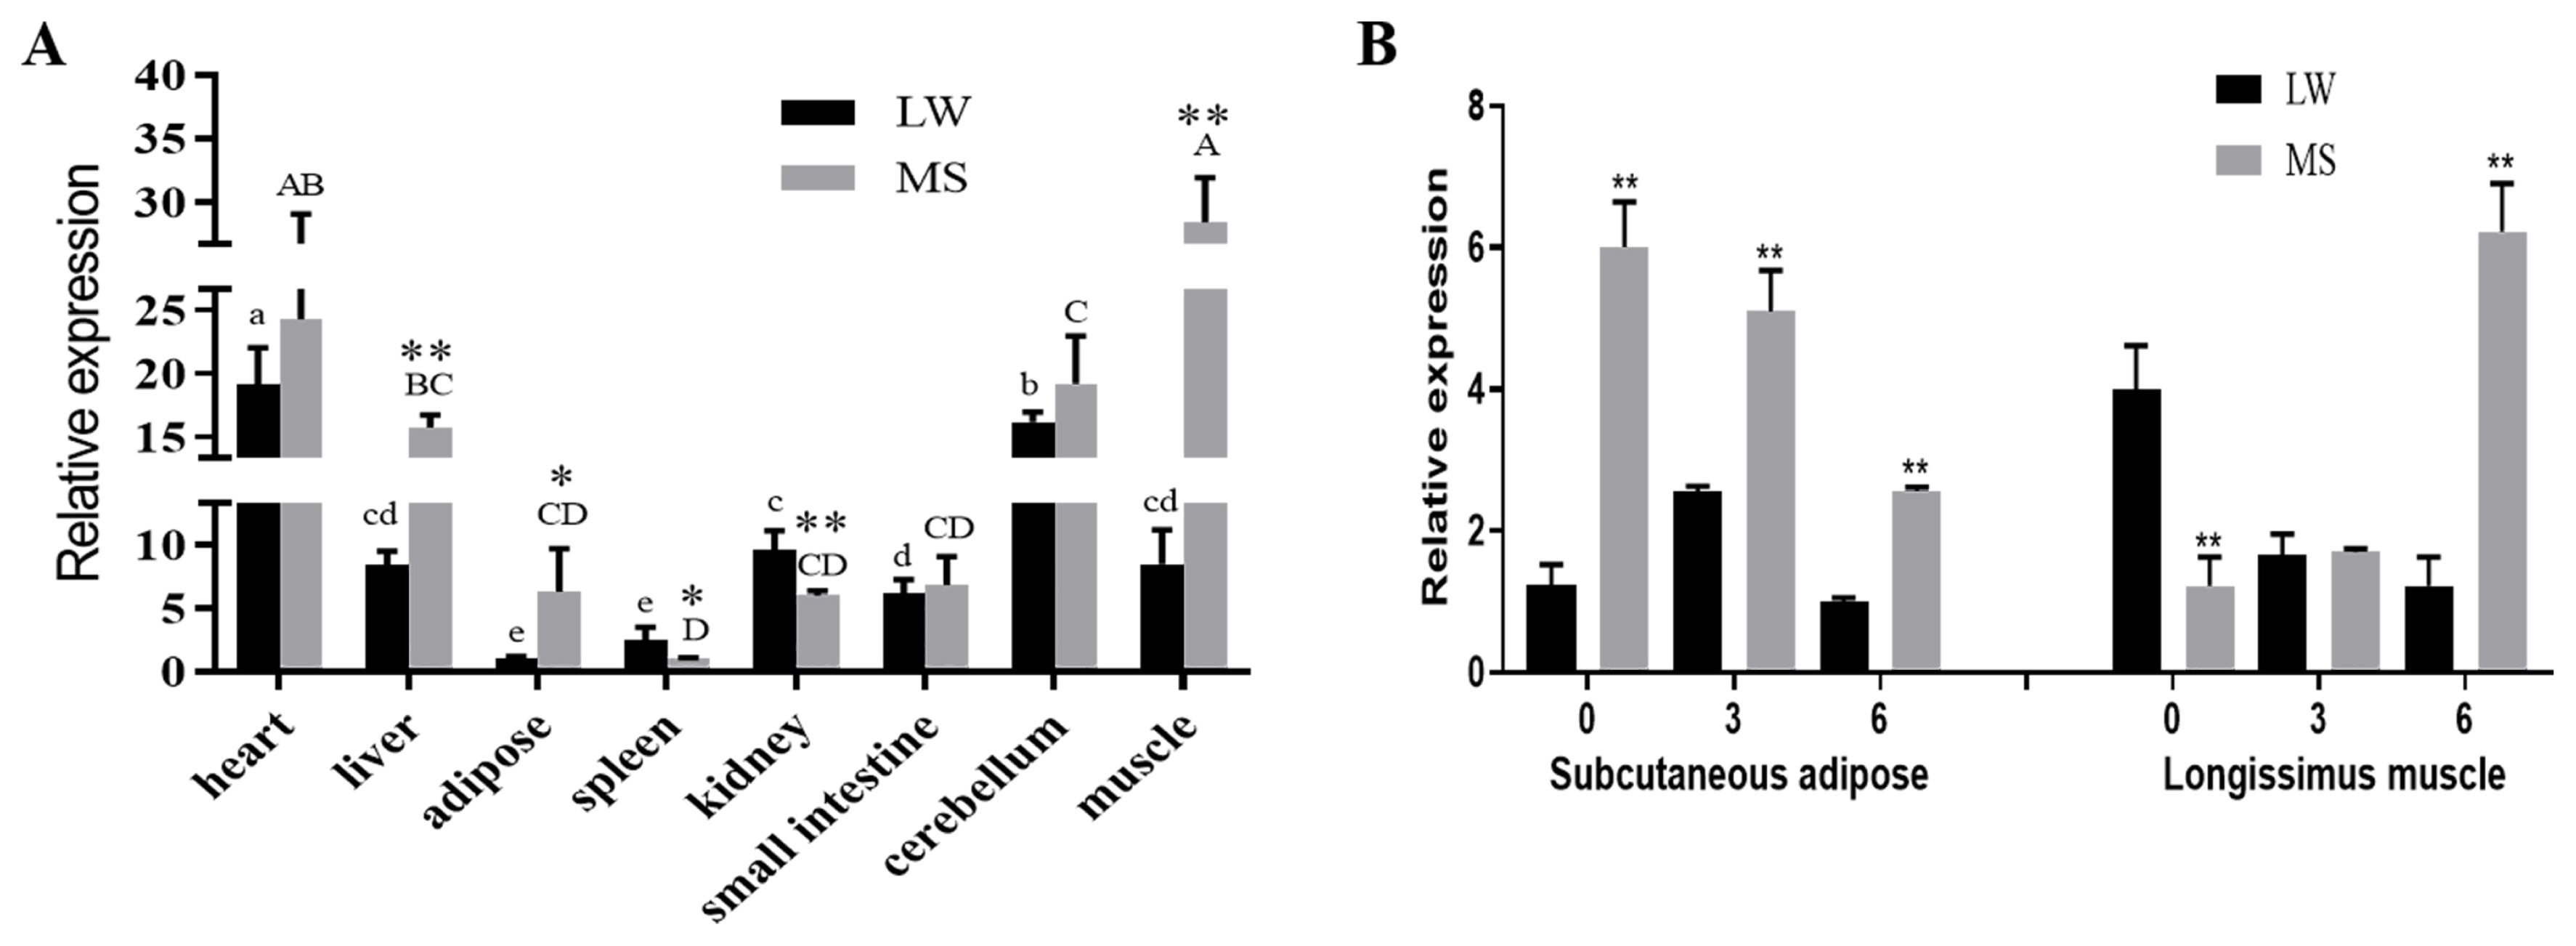
As shown in Figure 5, the GOT1 is expressed in the heart, liver, adipose tissue, spleen, kidneys, small intestine, cerebellum and muscle of both breeds. GOT1 expression was higher in the heart, liver and muscles but lower in the spleen. Higher mRNA levels of GOT1 were observed in the spleen and kidneys of the Large White pigs than those of the Mashen pigs (p<0.05). However, the mRNA expression levels in the muscles, liver and adipose tissue were all higher in the Mashen pigs than those of the other breed (p<0.05) (Figure 5A).
To study the temporal expression characteristics of GOT1, we measured its mRNA expression in the subcutaneous adipose of the 0-, 3-, and 6-month-old Mashen and Large White pigs. The results showed that expression of GOT1 in the Mashen pigs was remarkably higher than in the Large White pigs at each time point (Figure 5B). Considering that GOT1 had a significantly higher expression in the muscle of the Mashen pigs and that the IMF in the muscles increased with maturity, we also measured the GOT1 mRNA levels in the longissimus muscle. Compared with that of the Large White pigs, the mRNA level of GOT1 in the Mashen pigs was lower at birth (0-month-old) but reversely increased in the 6-month-old Mashen pigs (Figure 5B). These results implied that GOT1 played an important role in the adipose and late stage of IMF formation in Mashen pigs.
DISCUSSION
Pork is an important food source for humans. Given that the consumer’s preferences and needs continuously change, more and more people tend to choose a better quality of pork, promoting changes in the pork industry [13–15]. The IMF is fat between muscle fibres [16] and is one of the important factors that affect meat quality, because it is closely associated with muscle tenderness, meat colour, and meat flavour [17,18]. In mammals, the intramuscular adipocytes mostly contain triglycerides [19]. Nutrition, environment, genetics and other factors may result in changes in the IMF content. Amino acids can not only act as basic building blocks for proteins but also play an important regulatory role in lipid metabolism [20].
The clustered regularly interspaced short palindromic repeats (CRISPR)-CRISPR-associated protein-9 (Cas9) system is based on the complementary base pairing between a guide RNA and a target DNA to achieve the specific cleavage of genomic DNA. This system is widely used in studies on the modification of genome targets in different animals [21–23]. In this study, we used the website http://crispr.dbcls.jp/ to design sgRNA against the CDS region of the GOT1 gene. We selected three sequences with the highest scores to construct the knockout vectors. The results showed that the GOT1 protein was highly suppressed in the PK15 cells of the GOT1-KO3 group. This phenomenon demonstrated that, among the three constructed knockout vectors, GOT1-KO3 had the most significant GOT1 knockout effect. We then transfected this plasmid transfected into the 3T3-L1 cells. Then, the cells were induced to differentiate into mature adipocytes. Compared with the control group, lipid accumulation was significantly inhibited in the GOT1 knockout group. At the same time, the mRNA expression levels of adipogenesis markers, such as PPARγ and aP2, were significantly decreased. We also constructed GOT1 overexpression vectors, which were then transfected into 3T3-L1 cells. We found that GOT1 overexpression significantly promoted lipid accumulation.
To examine the effector mechanisms of GOT1 in lipid accumulation, we measured the expression levels of MDH1, which is involved in the malate shuttle. The results showed that they are significantly reduced in the knockout group. However, the expression levels of MDH1 were significantly increased in the overexpression group. Interestingly, the MDH1 content in the muscle tissues had a significant positive correlation with IMF. MDH1 activity tests in the muscles of both breeds demonstrated that the MDH1 activity in the Mashen pigs was significantly greater than that in the Large White pigs [6]. In a study, the overexpression of MDH1 in the 3T3-L1 cells induced a significant increase in the number of cells undergoing adipogenesis. In addition, the expression levels of the adipogenesis markers, such as PPARγ and C/EBPα, were also significantly increased when MDH1 was overexpressed [24]. This result indicated that MDH1 could affect meat quality by affecting the IMF content. During the amino acid metabolism, aspartate underwent catalysis by GOT1 in the cytoplasm to become oxaloacetate, which then underwent MDH1 catalysis to form malate. The malate produced in the aforementioned process was catalysed by ME1 to become pyruvate. After pyruvate entered the citric acid cycle, it was oxidised under PDHA1 catalysis to become acetyl-CoA, H+, CO2, and NADH [25]. Acetyl-CoA from the PDHA1-catalysed reaction is an important raw material for the citric acid cycle and synthesis of the fatty acid and cholesterol [26]. NADPH, which has antioxidant effects, was synthesised by the ME1-catalysed malic acid reaction. NADPH is an important reducing agent that can catalyse the synthesis of fatty acid [27]. The synthetic pathways for intracellular NADPH occurred through the redox branch of the pentose phosphate pathway and the malate shuttle pathway [28]. In the adipocytes, the NADPH produced by the malate shuttle pathway was higher than that produced by the pentose phosphate pathway [29]. A study has shown that MDH1 overexpression could result in more NADPH synthesis [30]. The NADP/NADPH ratio was inversely proportional to the NADPH content, and NADPH was significantly decreased in the knockout group. The NADPH content was significantly increased in the overexpression group. Given that GOT2 is also involved in the malate shuttle, we simultaneously measured the mRNA expression levels of the GOT2 gene. We found that the mRNA expression levels of GOT2 did not significantly change in either the knockout or overexpression groups. This phenomenon also indirectly proved that the malate produced in the malate shuttle (in which GOT1 participated) was mostly used in the cytoplasm for NADPH synthesis and not in the mitochondrial matrix. By combining the NADPH synthesis and the above study results, we demonstrated that GOT1 regulated adipocyte differentiation by altering the NADPH content.
Then, we further analysed the spatiotemporal expression characteristics of GOT1 between the Mashen pigs (naturally obese) and Large White pigs (naturally lean). The results showed that the expression levels of the GOT1 adipose tissue in the Mashen pigs were significantly higher than in the Large White pigs (p<0.01), which suggested that the high expression of GOT1 may be a key factor in the higher fat content in the Mashen pigs [6,7]. Interestingly, the mRNA level of GOT1 in the longissimus muscle of the Mashen pigs was significantly increased at 6 months of age. Combined with the high IMF content in the Mashen pigs, we hypothesized that GOT1 played an important role in the late stage of fat formation, which resulted in significant differences in the IMF in the later growth of these two pig breeds.
CONCLUSION
We found a positive role of the amino acid metabolism-associated gene GOT1 in adipogenic differentiation. The function of GOT1 was at least partially mediated by alteration in the NADPH content. Studying the role and mechanism of GOT1 in adipogenesis will provide a preliminary understanding of GOT1 in the distinct lipid depositions between the Mashen pigs and Large White pigs and the corresponding theoretical basis to improve the quality of pork.
 PDF Links
 PubReader
 ePub Link
 Full text via DOI
 Download Citation
 Print
Print


