Go to Top Go to Bottom
Anim Biosci > Volume 33(7); 2020 > Article
Nwogwugwu, Kim, Chung, Jang, Roh, Kim, Lee, Choi, and Lee: Effect of errors in pedigree on the accuracy of estimated breeding value for carcass traits in Korean Hanwoo cattle

Abstract

Objective

This study evaluated the effect of pedigree errors (PEs) on the accuracy of estimated breeding value (EBV) and genetic gain for carcass traits in Korean Hanwoo cattle.

Methods

The raw data set was based on the pedigree records of Korean Hanwoo cattle. The animals’ information was obtained using Hanwoo registration records from Korean animal improvement association database. The record comprised of 46,704 animals, where the number of the sires used was 1,298 and the dams were 38,366 animals. The traits considered were carcass weight (CWT), eye muscle area (EMA), back fat thickness (BFT), and marbling score (MS). Errors were introduced in the pedigree dataset through randomly assigning sires to all progenies. The error rates substituted were 5%, 10%, 20%, 30%, 40%, 50%, 60%, 70%, and 80%, respectively. A simulation was performed to produce a population of 1,650 animals from the pedigree data. A restricted maximum likelihood based animal model was applied to estimate the EBV, accuracy of the EBV, expected genetic gain, variance components, and heritability (h2) estimates for carcass traits. Correlation of the simulated data under PEs was also estimated using Pearson’s method.

Results

The results showed that the carcass traits per slaughter year were not consistent. The average CWT, EMA, BFT, and MS were 342.60 kg, 78.76 cm2, 8.63 mm, and 3.31, respectively. When errors were introduced in the pedigree, the accuracy of EBV, genetic gain and h2 of carcass traits was reduced in this study. In addition, the correlation of the simulation was slightly affected under PEs.

Conclusion

This study reveals the effect of PEs on the accuracy of EBV and genetic parameters for carcass traits, which provides valuable information for further study in Korean Hanwoo cattle.

INTRODUCTION

Pedigrees are essential tools in the livestock breeding industry, because they provide ancestral information and knowledge for predicting progeny performance. A pedigree record contains the performance records of individuals and their progeny, and each domestic animal species has traits that are of economic value. For examples, meat and milk traits in cattle, sheep and goats [1]. Carmen [2] reported that pedigree was initially used in cattle breeding and other domestic animals. Henceforth, it becomes the principal breeding tool in the livestock sector. The importance of pedigree records in livestock breeding cannot be overemphasized, because the accuracy of selection depends on the superiority and size of the performance records that are available. Pedigree and performance records have been previously used for evaluation of genetic improvement and selection of animals with the highest genetic merit [3]. More so, the pedigree information can explain the genetic differences between and within individuals, creating an essential technique to evaluate parameters such as inbreeding, generation interval, estimated breeding value (EBV), heritability, and effective population size. These parameters could be utilized for proper selection and maintenance of healthy and genetically superior animals [4]. Pedigree and performance records have been earlier used to evaluate the genetic merit of animals in Hanwoo breeding scheme with proper selection of proven bulls [5]. Lee et al [6,7] also used Hanwoo pedigrees to identify the major loci associated with carcass weight (CWT) and intramuscular fat. On the other hand, Long et al [8] stated that the use of raw data for estimation of EBV of livestock could produce biased estimates when pedigree contains errors. In this case, these estimates would be an inaccurate genetic evaluation and slower genetic progress in that population.
Harder et al [9] described two types of pedigree errors (PEs), which could affect the EBV and genetic gain in a dairy cattle population. One of them is missing pedigree information (unknown parents), whereas the other is mistaken pedigree information (wrong parents). They added that, the proportion of wrong paternity decreased the estimates of genetic parameters. Previous studies by Israel and Weller [10], Christensen et al [11], and Gelderman et al [12] showed the consequences of PE or incorrect sire information in estimation of genetic parameters, for example, decreased value of parent transmitting ability for a cow and her relatives, reduced EBV, h2, and genetic gain for meat and milk traits in cattle populations. In addition, biased estimates of EBV and genetic gain for both bulls and cows have been reported [10,1315]. Although, the effect of PEs on the accuracy of EBV and genetic estimates might not be available in Korean Hanwoo cattle. As a result, the knowledge of PEs on the accuracy of genetic parameters (EBVs, genetic gain, and h2) would be useful in the Hanwoo beef industry. Therefore, the aim of this study was to assess the effect of PEs on the accuracy of EBV and genetic gain for carcass traits.

MATERIALS AND METHODS

Raw data

The raw data set was based on the pedigree records of Korean Hanwoo cattle, which were the offspring of Korean proven bulls with different dam lines. The animals’ records were obtained using Hanwoo registration records from Korean animal improvement association database [16]. The record comprised of 46,704 animals, where the number of the sires used was 1,298 and the dams were 38,366 animals. The pedigree record consists of the performance and progeny test data sets of contemporary and ancestral relatives. The traits considered were CWT, eye muscle area (EMA), back fat thickness (BFT), and marbling score (MS). The measurements of carcass traits were in accordance with animal product grading service in South Korea [17]. Information about the production and breeding systems of Korean Hanwoo cattle are in accordance with Kim et al [18].

Pedigree errors

Errors were introduced in the pedigree dataset through randomly assigning sires to all progenies born between 2000 and 2013. This method of changing sire records resulted in wrong sire information. SampleBy function in doBy package of the R software package was used for making PEs. For each generation, the pedigree dataset was substituted by error rates of 5%, 10%, 20%, 30%, 40%, 50%, 60%, 70%, and 80% as the true parent previously described in Oliehoek and Bijma [19].

Simulated data

A simulation was performed to produce one replicate population of 1,650 animals using QMSim software package [20]. The number of sires was 150 whereas the dams were 1,500. For this replicate, the above-mentioned method of misidentification and error rates were introduced into the simulated data. More so, the effect of PE was assessed up to 12 generations with their averages. A single trait with a heritability of 0.4 and phenotypic variance of 2,071.47 were simulated in our study. The replacement ratios were 0.5 for sire and 0.4 for dam per generation.

Statistical analyses

A restricted maximum likelihood (REML) based animal model was applied to estimate variance and covariance components of the studied traits using ASReml 4.0 software package [21]. The model included fixed effects of farm location (2), year of birth (3), and season of birth (7). A linear covariate of slaughter age was also fitted in the model. The mixed-model equation of the animal model used in the study was:
(1)
y=Xb+Zu+eand var[ue]=[AσA200IσE2]
where y, b, u, and e, are the vectors of phenotypes (lists of traits), fixed effects, random effects and residual errors, respectively, and X and Z are the design matrices.

Breeding value estimation

The similar animal model was also used for estimation of breeding values using Henderson’s BLUP method [22] as implemented in ASReml 4.0. The accuracies of EBV estimation under different error levels of the pedigree were then calculated for all studied traits. Pearson’s correlation was used for each trait to assess the influence of PEs on the prediction of EBV.

Expected genetic gain

The expected genetic gain from the selection was calculated using the following equation.
(2)
ΔGyr=i×rIH×GAL
where ΔGyr = expected genetic gain/yr, i = intensity of selection, rIH = accuracy, GA = genetic standard deviation, L = generation interval.
In the equation the term i, L were set as 0.80, 5.5, rIH = estimates in Table 3 per each trait, GA = square root of σ2a per each trait. Then, the expected genetic gain per year for each trait was obtained from the studied dataset.

Estimates of variances and heritability

The variance components as well as h2 estimates for carcass traits were estimated using a single trait animal model in equations (1), whereas the equation for h2 estimates was as follows,
(3)
h2=σ2a/σ2p
where σ2a, additive genetic variance; σ2p, phenotypic variance; h2, heritability.

RESULTS

The average carcass traits per year are presented in Table 1. All the traits showed inconsistency between the years. The CWT, EMA, BFT, and MS showed an increase by 65.61 kg, 4.96 cm2, 1.76 mm, and 0.79, respectively. Table 2 illustrates the overall mean, standard deviation, minimum, maximum and coefficient of variation for carcass traits. The average values for CWT, EMA, BFT, and MS were 342 kg, 78.76 cm2, 8.63 mm, and 3.31, respectively.
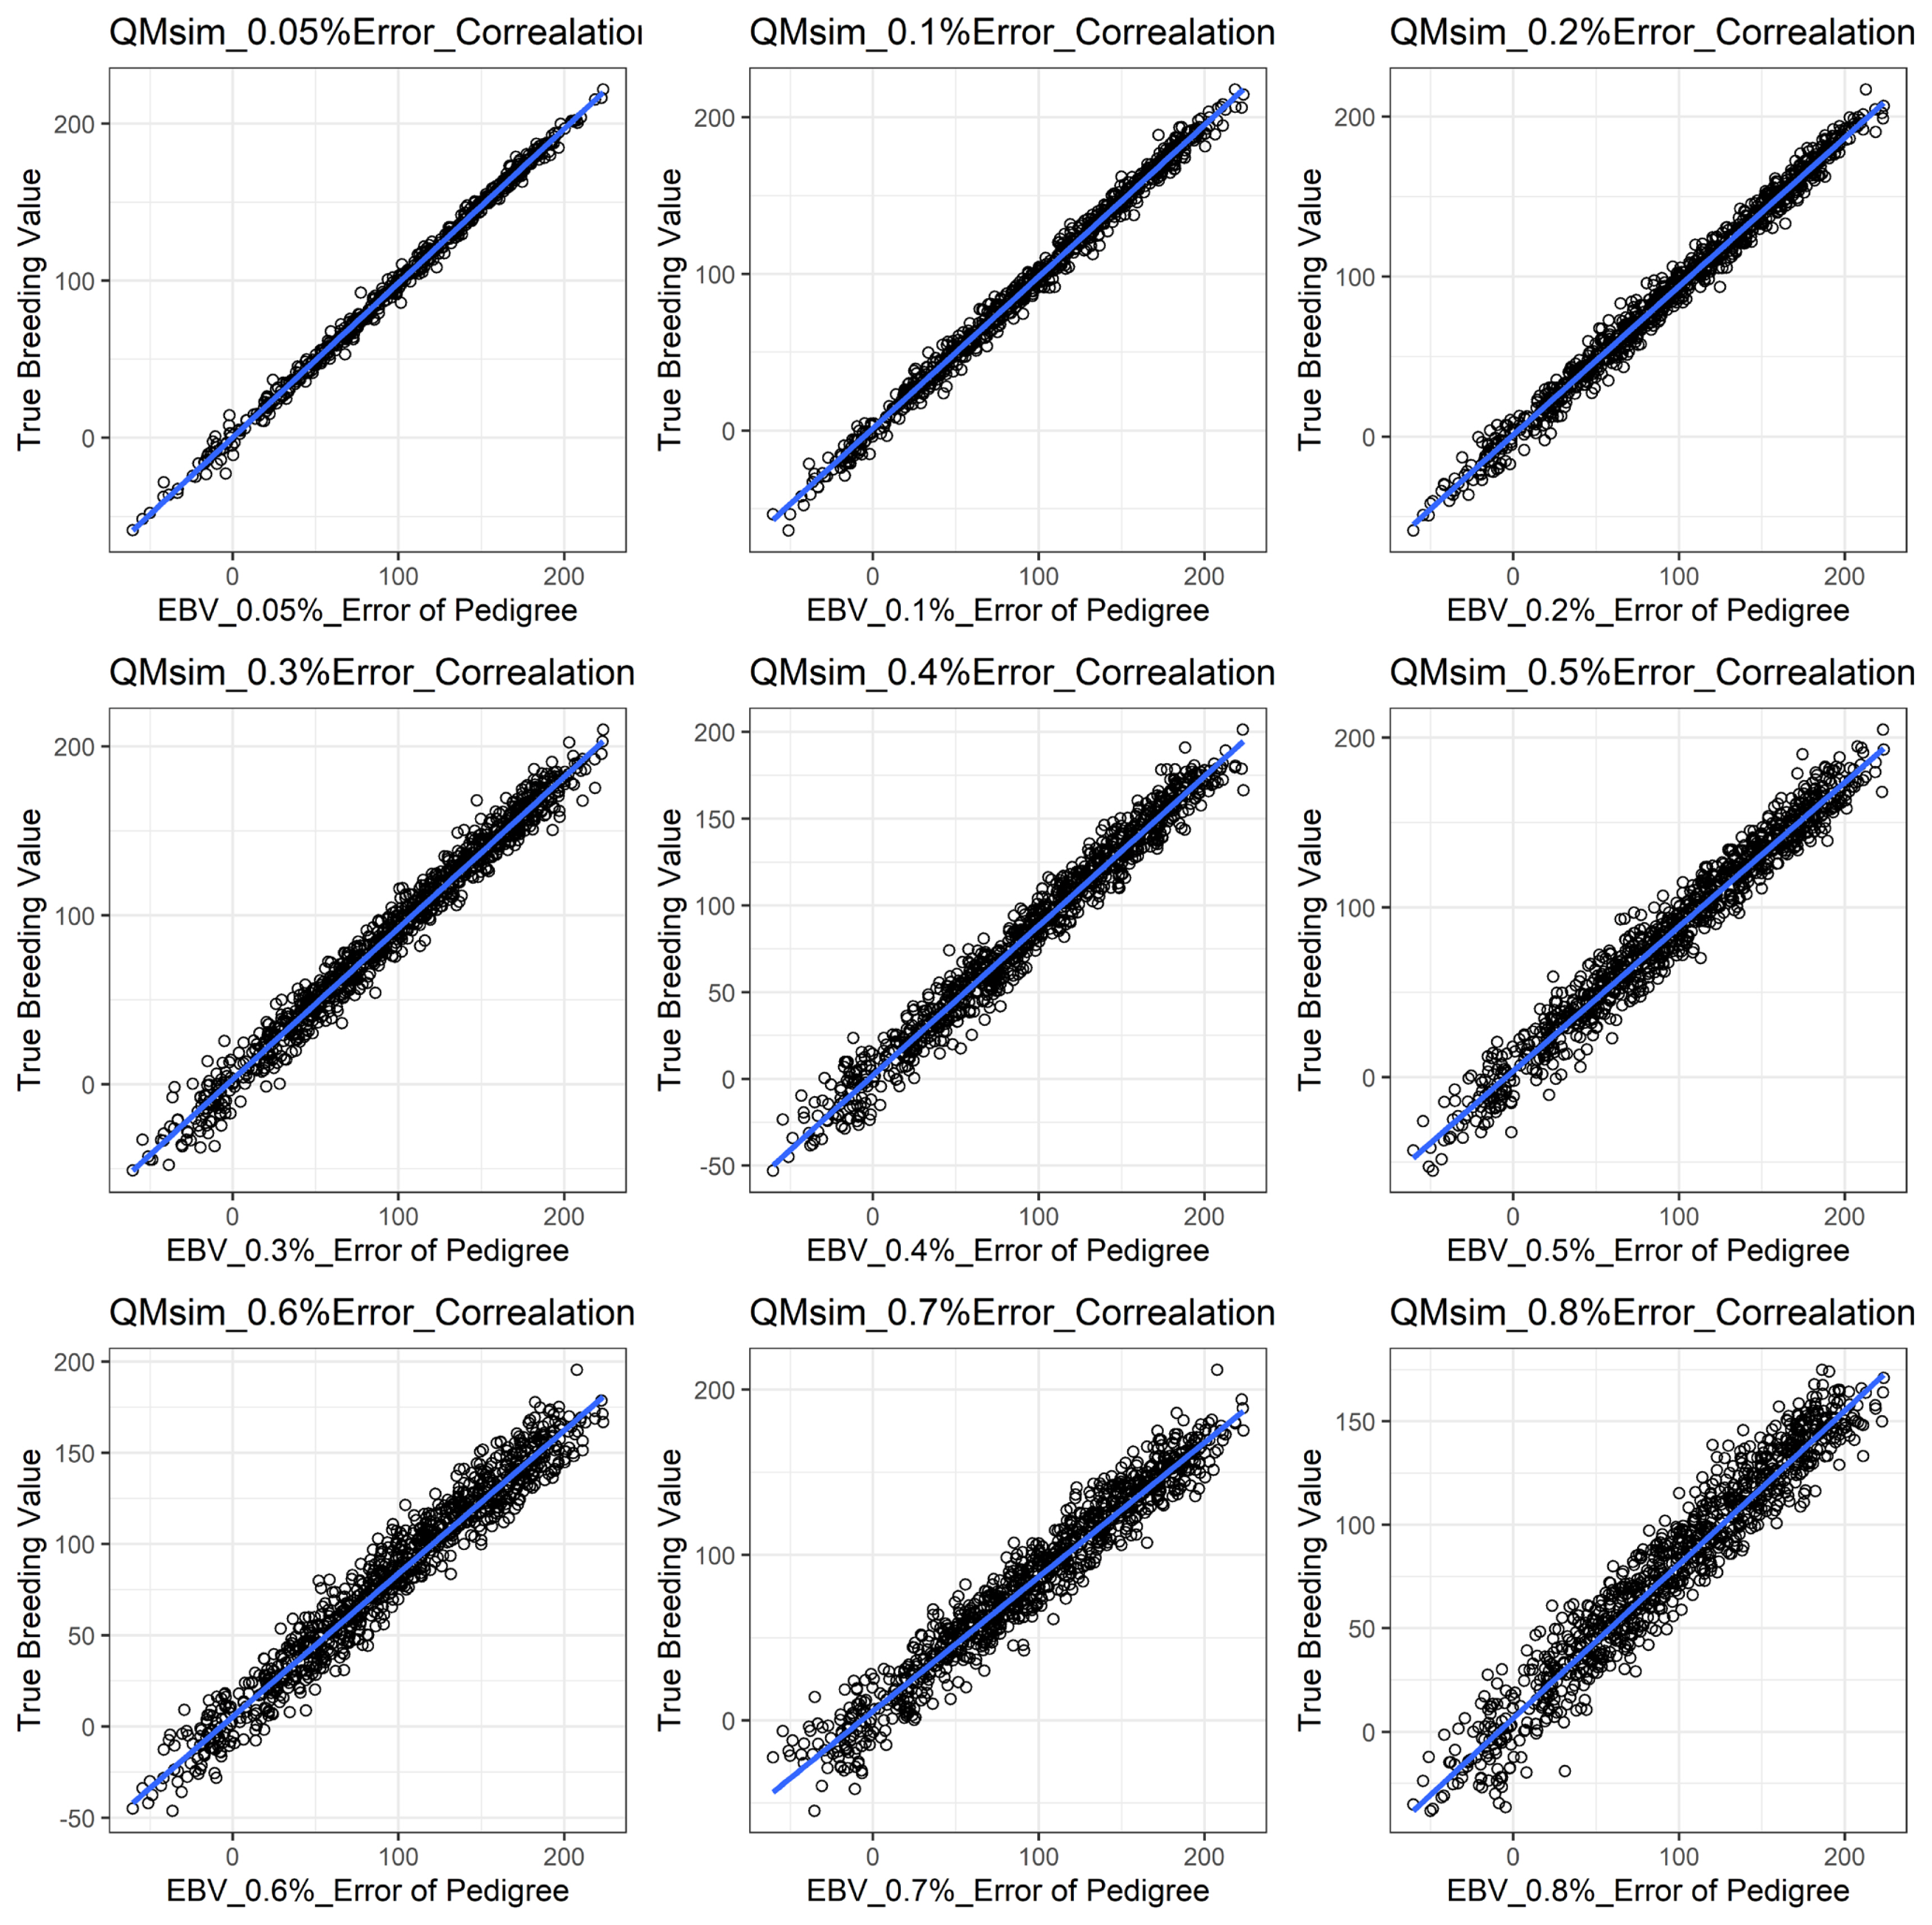
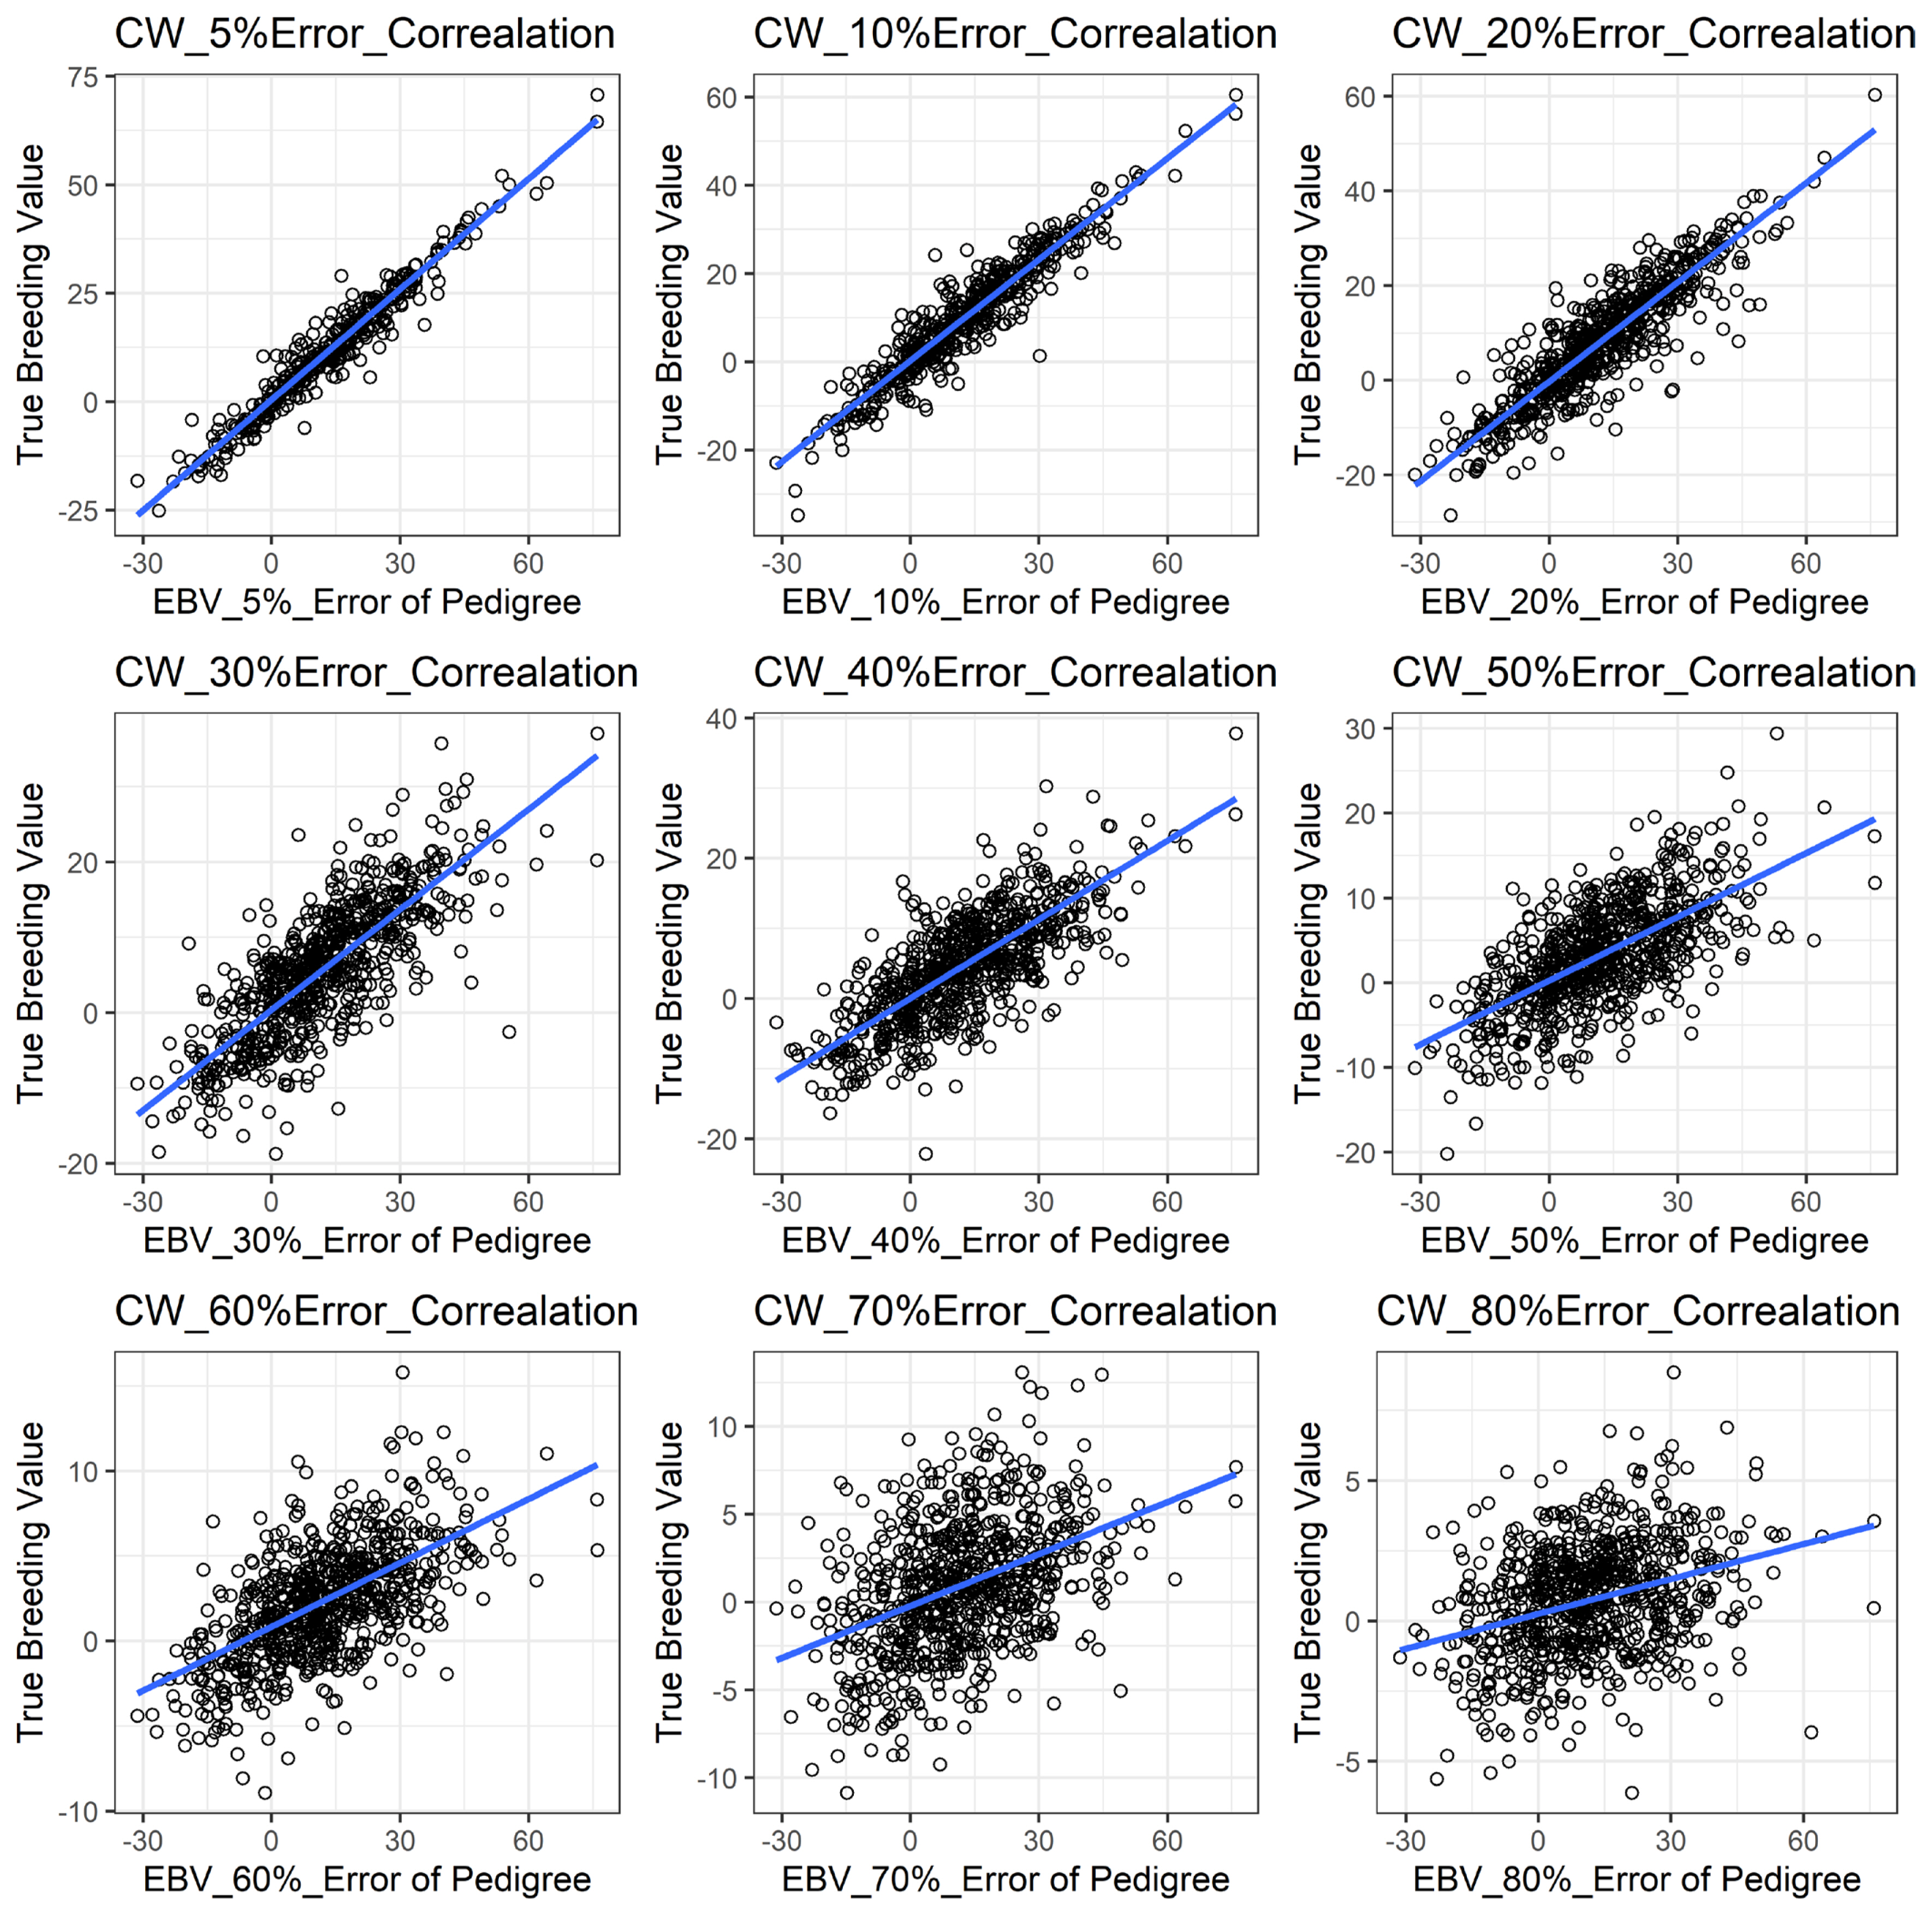
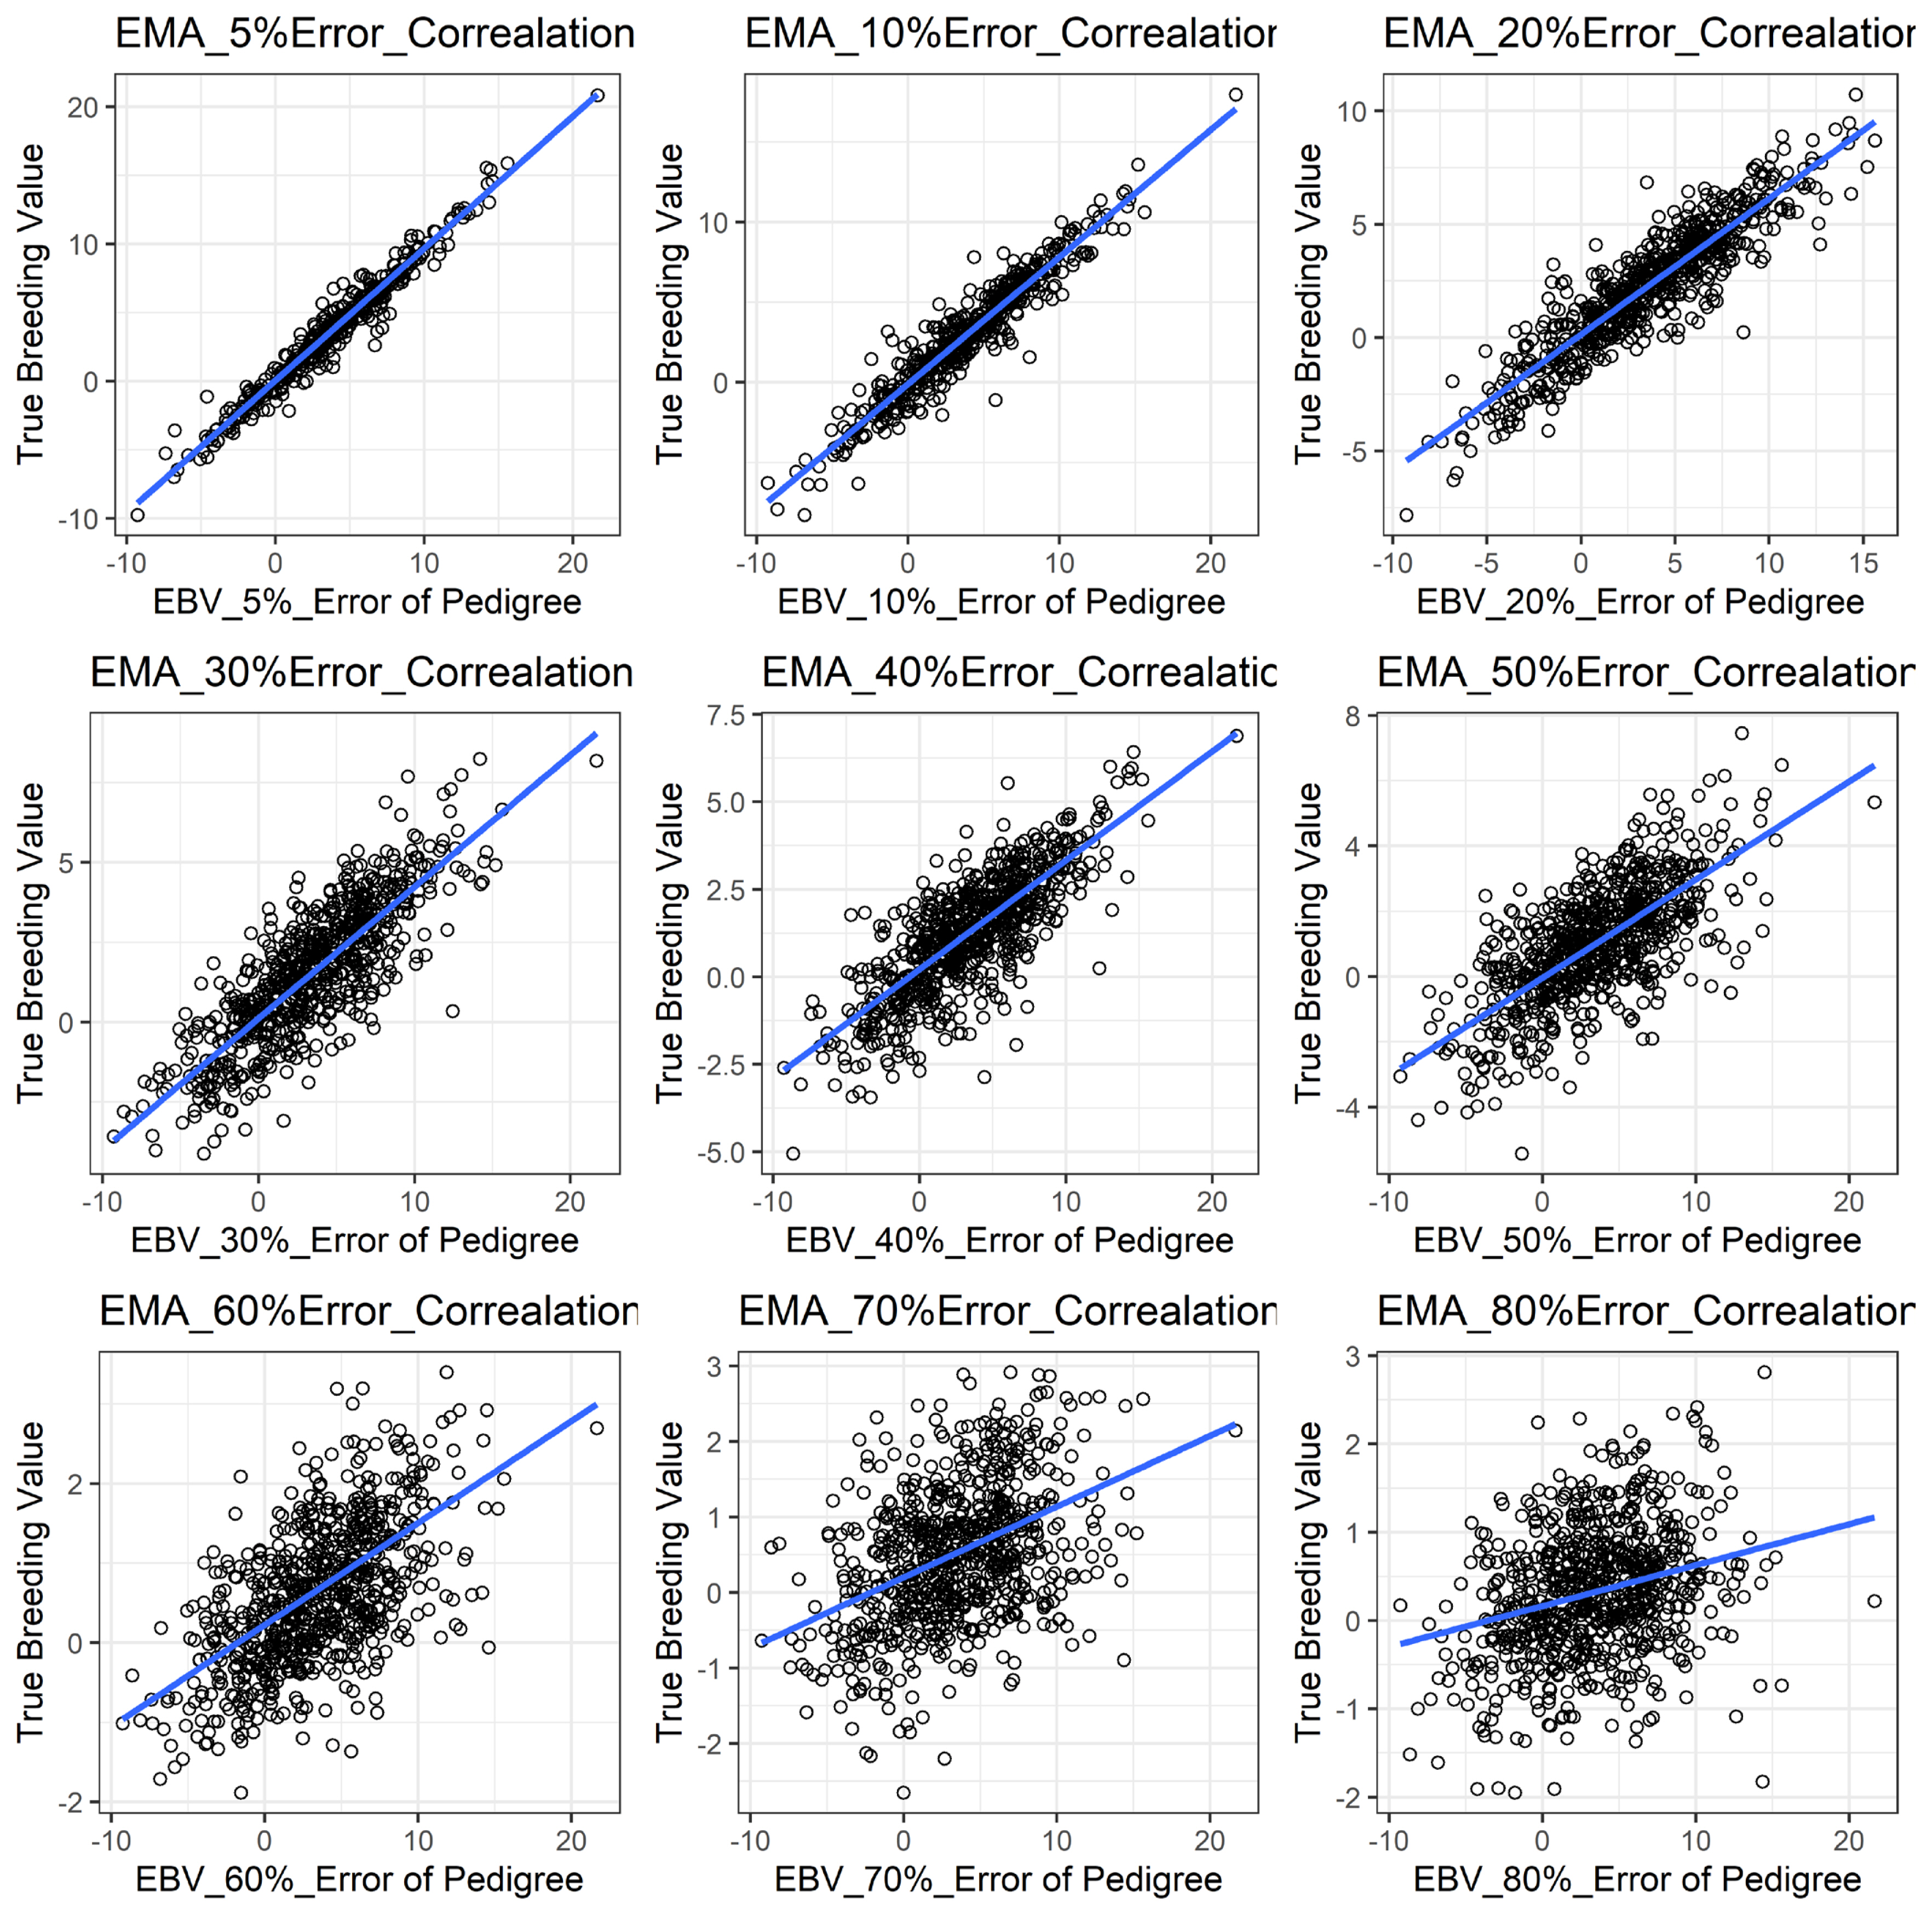
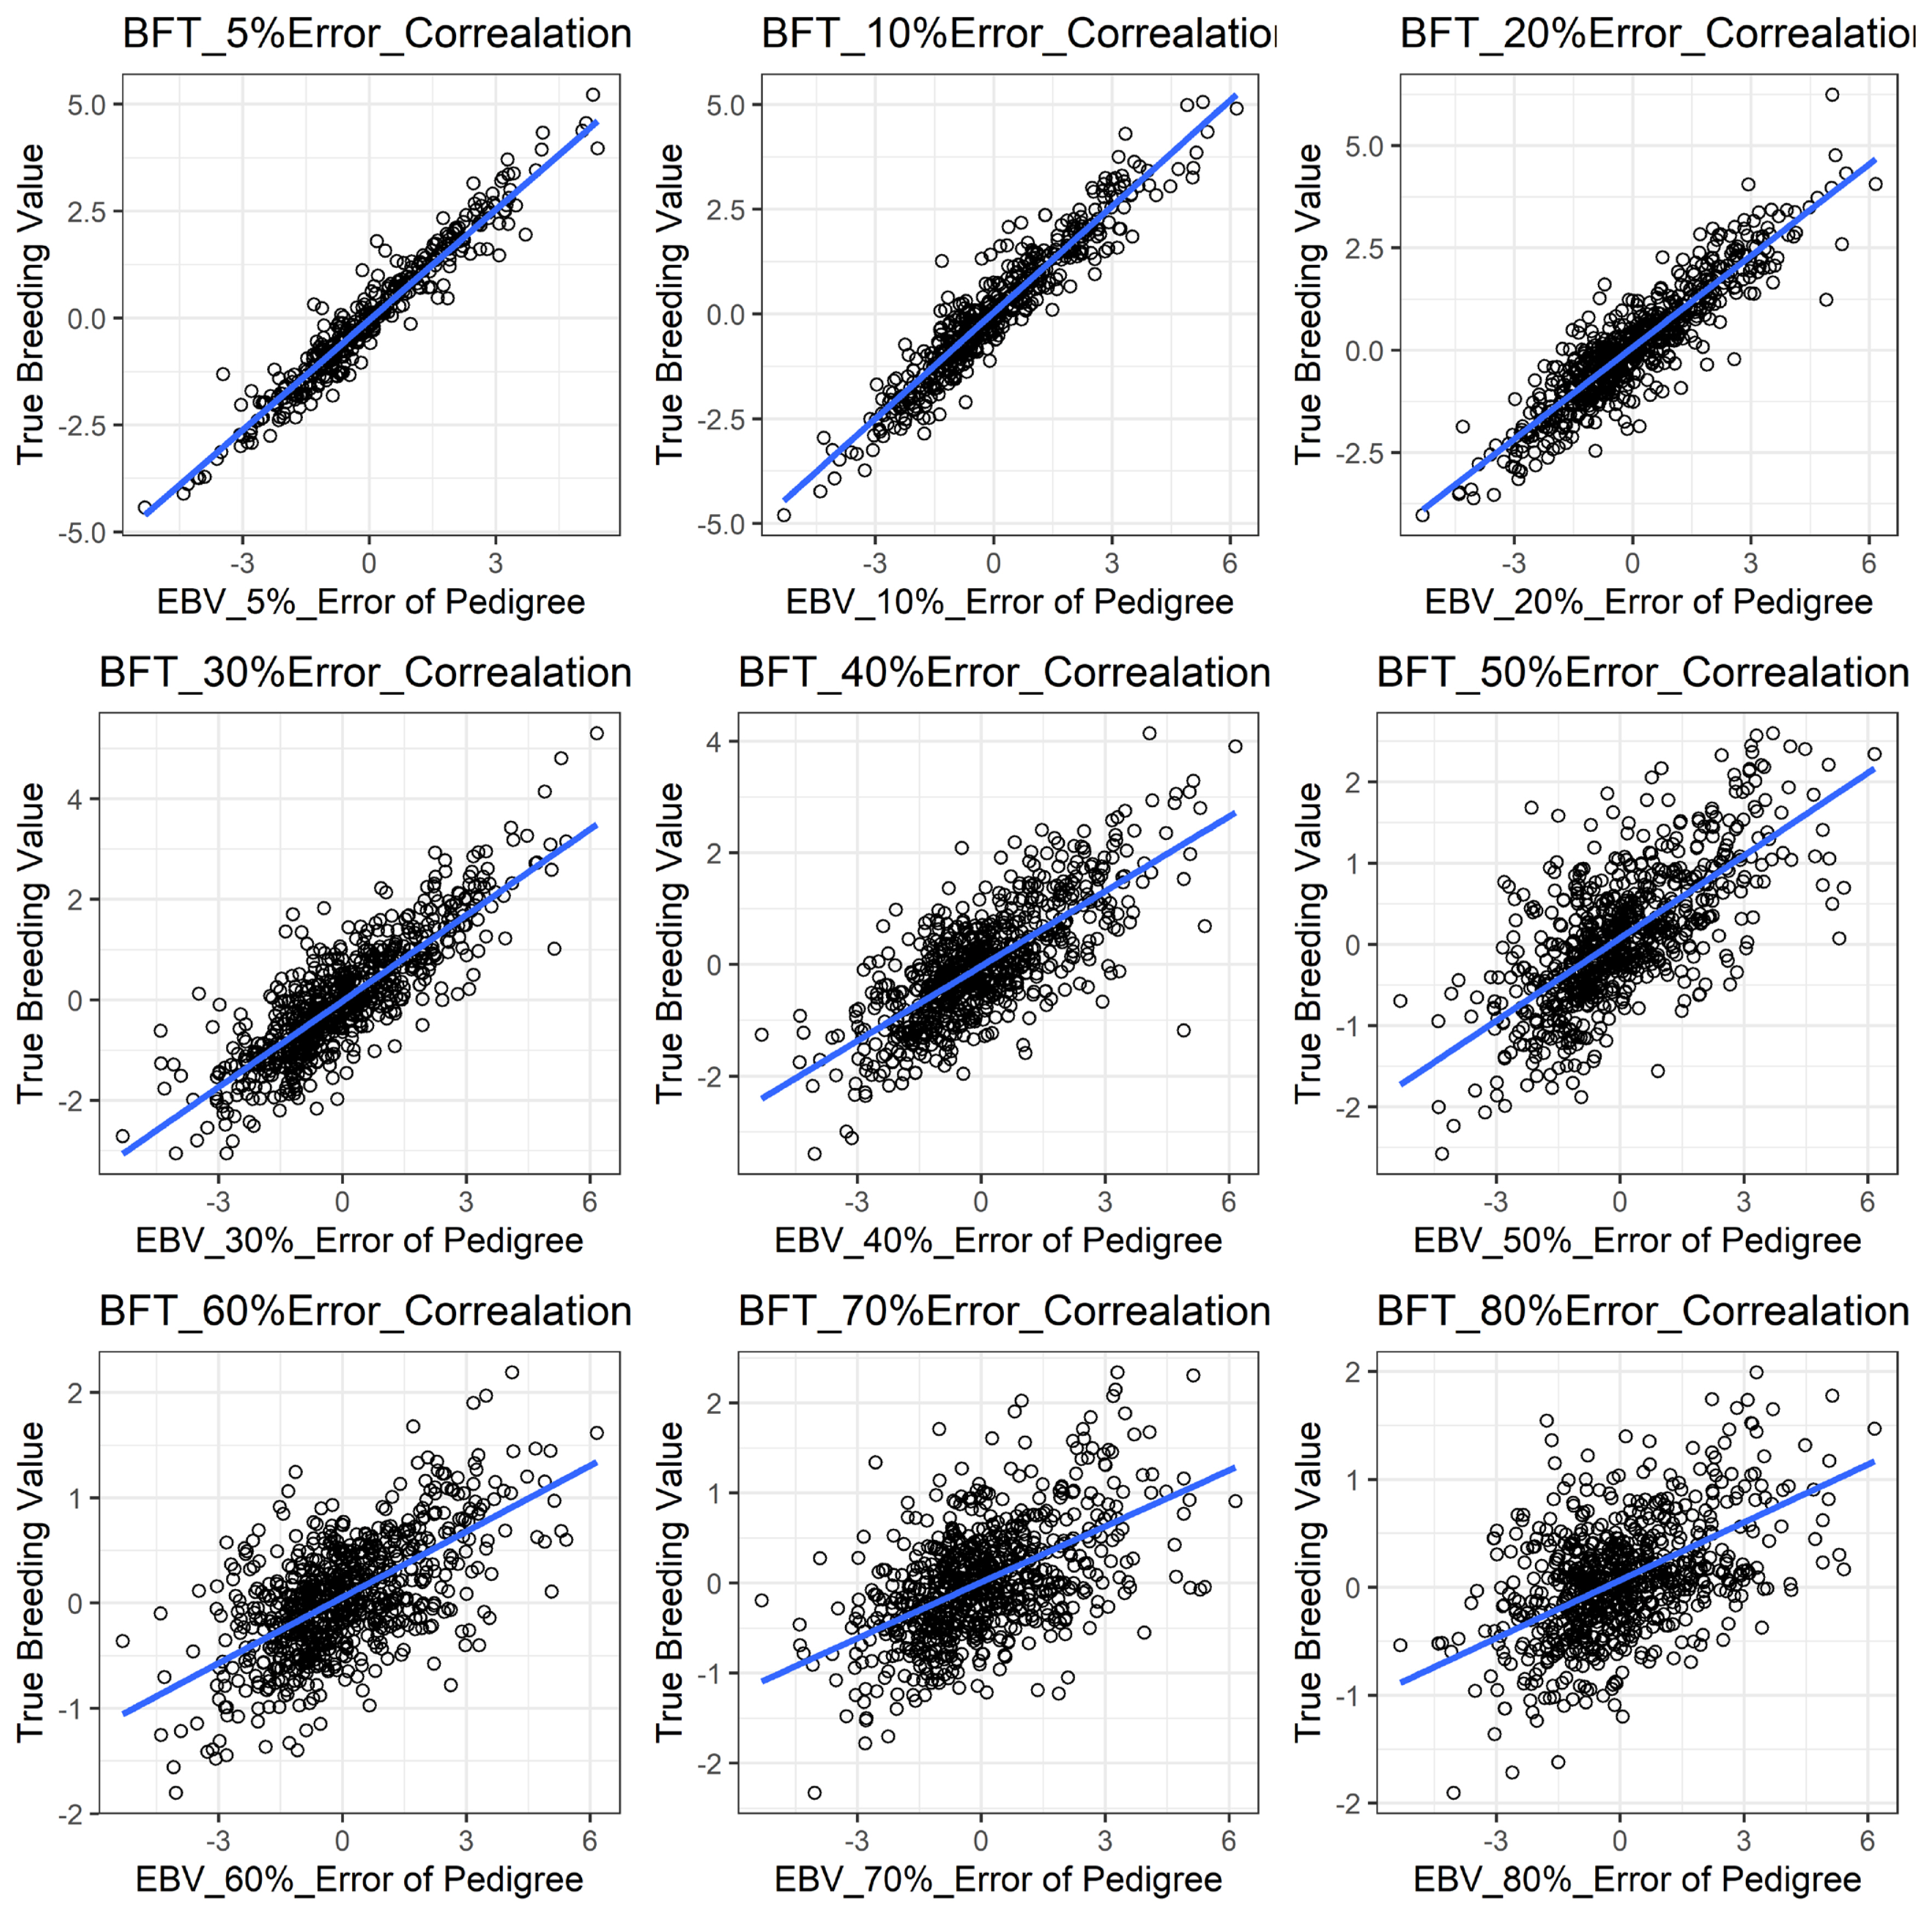
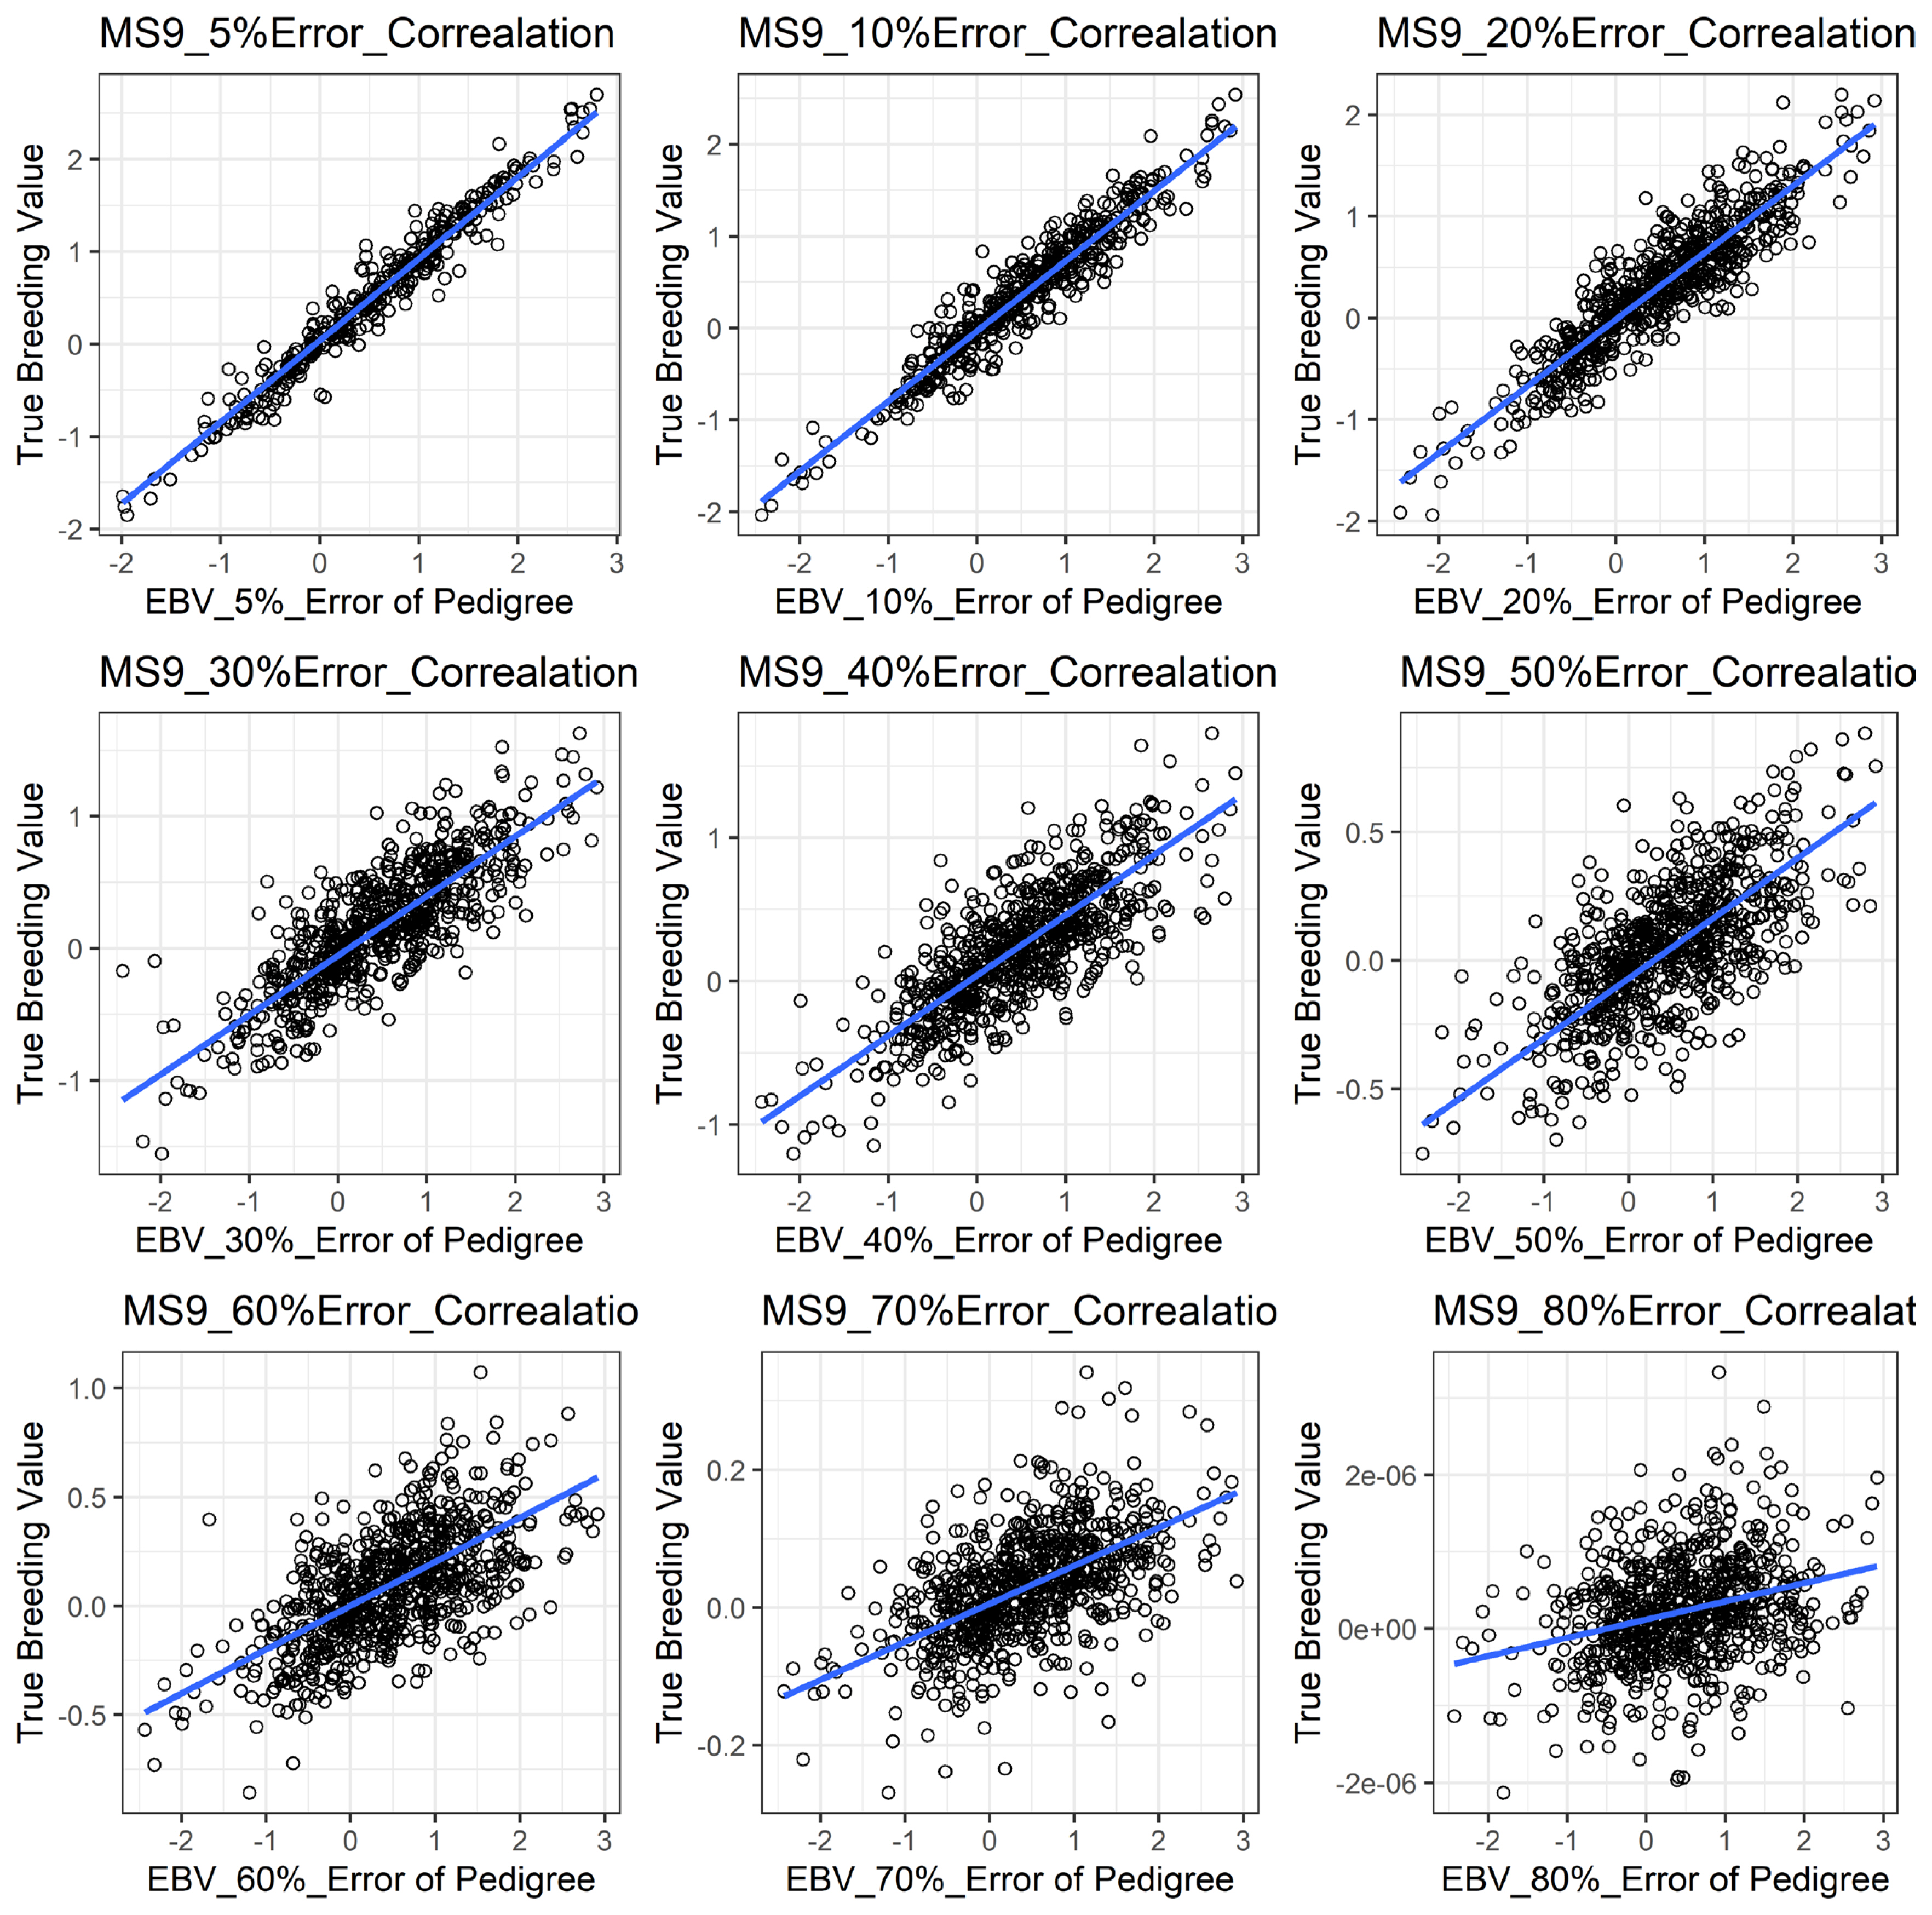
Figure 1 shows the accuracy of EBV for simulated data under PE scenario. The graphical presentations of the accuracy of EBVs for each trait under PE situation with raw data are shown in Figure 2 to 5. Table 3 indicates the EBV accuracy for carcass traits under PE scenario, and the result shows that all the studied traits were affected by errors. The correlations of the simulated data under PE are presented in Table 4. The result indicates that, the correlation of the carcass trait was slightly decreased as errors were introduced in the pedigree.
Table 5 shows the expected genetic gain for carcass traits. In this study, the expected genetic gain for carcass traits were 3.13 kg, 0.80 cm2, 0.34 mm, and 0.17 for CWT, EMA, BFT, and MS with no PE (0%), and that deemed to decline constantly as PEs were increased gradually in the dataset. With a 5% PE, the decline in the traits were 0.34 kg, 0.03 cm2, 0.01 mm, and 0.01 for CWT, EMA, BFT, and MS with respect to that estimate at 0% PE. This result was followed by the highest values of 2.85 kg, 0.73 cm2, 0.26 mm, and 0.17 decline at 80% PE.
Table 6 presents the variance components and h2 estimates for carcass traits. For CWT, the estimated h2 with no PE was 0.36 in this study. However, this h2 decreased consistently as more PE introduced in the dataset and reached to as low as 0.03 at 80% of PE. A very similar negative effect of PE on h2 of EMA was observed as well, where h2 with no error was estimated as high as 0.42 and as low as 0.05 at 80% PE. The presence of PE equally affected the h2 of BFT and MS. In this regard, BFT h2 was reduced from 0.48 with no PE to 0.11 with 80% of PE, whereas for MS, such decrease in h2 was from 0.58 to a negligible heritability (0.00).

DISCUSSION

In this study, we assessed the effect of PE on the accuracy of EBVs, genetic gain, and h2 estimates of carcass traits. In general, the carcass traits per year were evaluated from 2000 to 2013 as shown in Table 1, which shows overall improvements in most of the traits. Although, increased value of carcass traits was not consistent between the years. Park et al [23] reported similar observations on carcass traits between 1998 and 2012. In addition, a comparison of carcass traits between 2000 and 2013 indicated an increase in our study.
The overall mean of carcass traits is presented in Table 2. Park et al [23] and Yoon et al [24] reported similar results for carcass traits previously in Hanwoo Korean cattle. More recently, Do et al [25] reported slightly higher values for carcass traits in Hanwoo cattle compared with our study. On the other hand, lesser values in some of the carcass traits have been observed [26] in Japanese black (Wagyu). Additionally, we need to consider the influences from the breed under study or genotype-environment interactions on animals that could introduce variations in growth and carcass traits, as suggested earlier by Fabrizio et al [27].
With a dataset including PE, some parameters were found to be influenced in our study (Table 3). We observed that PE had negative associations with the accuracy of EBV of the studied traits. In this case, more errors in the pedigree also reduced the evaluation accuracy in those traits noticeably and that could be a great disadvantage to selection responses in the breeding program. Our results are also in accordance with Israel [10], Ron et al [13], and Bovenhuis and Van Arendonk [28] that similarly reported lower accuracy in EBV with the presence of errors in the pedigree. All traits in this study showed similar trends with respect to PE, even though there were differences in magnitudes of influences on each trait evaluation. Long et al [8] in this regard, agreed with our results by showing a reduction in accuracy of EBV for litter size, BFT and average daily gain in swine. Banos et al [29] also reported a 9% milk yield decrease in bull due to PE in their study.
The correlations of the simulated data under PE were slightly reduced in our study as shown in Table 4. Our results indicated that the influence of PE on the correlation was somewhat lower. This is probably because our simulated population was not as complicated as the raw dataset. Similar reductions in response between simulated BV and EBV were observed by the study of Van Arendonk et al [30].
We found that the expected genetic gain in animals was also largely reduced due to PEs as presented in Table 5. Our estimated genetic gain and its reduction due to PE is also comparable to other studies by Long et al [8], Israel [10], Christensen et al [11], and Bovenhuis and Van Arendonk [28]. A report on reduced genetic gain, as Angeln dairy cattle population by Sanders et al [31], due to either erroneous or missing sire information was also in agreement with this study. Van Arendonk et al [30] also reported lower genetic gain in a closed pig-breeding nucleus with introduction of errors in the pedigree.
The variance components and h2 estimates for carcass traits are illustrated in Table 6. For all the studied traits, the h2 estimates were negatively affected as more errors were introduced in the pedigree. The h2 being affected by PE also indicated that such errors could reduce the selection accuracy at the same time. For this reason, h2 is very important to selection for polygenic traits, because selection accounts for those animals with the best breeding values to become the parents of the next generation. In order to increase selection accuracy, we need good information about the candidates for selection because the only information available is the phenotypic records, which is the strength of the relationship between phenotypic values and breeding values (i.e., h2). Therefore, when h2 is low, the phenotypic values mostly reveal little about the underlying breeding values, and it is difficult to determine which animals have the best breeding values to become the potential parents [32]. Our study is also comparable to those reported earlier by Senneke et al [33] who observed a reduction in h2 estimates for birth and weaning weights in Herford cattle. Previous studies by Gelderman et al [12], and Parlato and Van Vleck [34] also reported decreased h2 estimates in milk fat and milk yield in both cattle and buffalo populations under erroneous pedigree.

CONCLUSION

The accuracy of EBV, genetic gain, and heritability estimates for the studied traits were affected by introduction of errors in the pedigree. On the other hand, the result of the correlation estimates of simulated data for carcass trait was slightly decreased as errors were introduced in the pedigree. As a result, PEs had a negative effect on the overall estimates, which could slower the rate of genetic or selection progress in a population.

Notes

CONFLICT OF INTEREST

We certify that there is no conflict of interest with any financial organization regarding the material discussed in the manuscript.

ACKNOWLEDGMENTS

This study was carried out with the support of “Cooperative Research Program for Agriculture Science and Technology Development (Project No. PJ0132002019)” Rural Development Administration, RDA, Republic of Korea.

Figure 1
The accuracy of EBV of carcass trait for simulated data under pedigree error scenario. This indicates that the accuracy of EBV of a carcass trait for simulated data slightly declined with increased error rates. EBV, estimated breeding value.
ajas-19-0021f1.jpg
Figure 2
The accuracy of EBV for CWT under different pedigree error rates. This illustrates the negative effect of error in pedigree on the accuracy of EBV for CWT. The accuracy of EBV for CWT continues to decrease with increased errors. EBV, estimated breeding value; CWT, carcass weight.
ajas-19-0021f2.jpg
Figure 3
The accuracy of EBV for EMA under different pedigree error rates. This illustrates the negative effect of error in pedigree on the accuracy of EBV for EMA. The accuracy of EBV for EMA continues to decrease with increased errors. EBV, estimated breeding value; EMA, eye muscle area.
ajas-19-0021f3.jpg
Figure 4
The accuracy of EBV for BFT under different pedigree error rates. This illustrates the negative effect of error in pedigree on the accuracy of EBV for BFT. The accuracy of EBV for BFT continues to decrease with increased errors. EBV, estimated breeding value; BFT, back fat thickness.
ajas-19-0021f4.jpg
Figure 5
The accuracy of EBV for MS under different pedigree error rate. This illustrates the negative effect of error in pedigree on the accuracy of EBV for MS. The accuracy of EBV for MS continues to decrease with increased errors. EBV, estimated breeding value; MS, marbling score.
ajas-19-0021f5.jpg
Table 1
Average phenotypic values for carcass traits per year
Year CWT (kg) EMA (cm2) BFT (mm) MS9
2000 313.37 75.61 7.84 -
2001 307.69 75.54 6.90 -
2002 324.43 74.33 8.06 -
2003 352.04 75.72 10.59 3.57
2004 356.07 78.63 10.49 3.21
2005 360.36 76.87 10.46 3.21
2006 358.18 79.65 10.60 3.33
2007 361.63 82.10 9.32 3.54
2008 360.31 84.16 8.16 3.13
2009 354.05 82.03 7.94 3.04
2010 361.45 83.91 8.27 3.03
2011 362.73 81.81 8.47 3.14
2012 359.32 79.58 8.21 3.32
2013 378.98 80.57 9.60 4.36

CWT, carcass weight; EMA, eye muscle area; BFT, back fat thickness; MS9, marbling score with 9 levels.

Table 2
Basic statistics for carcass traits
Trait Mean SD Min Max CV
CWT 342.60 45.51 158 518 0.13
EMA 78.76 9.23 22 123 0.12
BFT 8.63 3.71 1 35 0.43
MS 3.31 1.61 1 9 0.49

SD, standard deviation; Min, minimum; Max, maximum; CV, coefficient of variation; CWT, carcass weight; EMA, eye muscle area; BFT, back fat thickness; MS9, marbling score with 9 levels.

Table 3
Accuracy of estimated breeding value for carcass traits under different error levels
Pedigree error (%) CWT BFT EMA MS
5 0.96 0.96 0.97 0.97
10 0.94 0.94 0.95 0.95
20 0.90 0.90 0.91 0.89
30 0.77 0.83 0.81 0.81
40 0.75 0.73 0.78 0.78
50 0.63 0.68 0.69 0.70
60 0.57 0.62 0.56 0.61
70 0.40 0.53 0.38 0.55
80 0.30 0.52 0.24 0.26

CWT, carcass weight; BFT, back fat thickness; EMA, eye muscle area; MS9, marbling score with 9 levels.

Table 4
Correlation estimates of simulated data under pedigree error
Pedigree error (%) Correlation coefficient
5 0.99
10 0.99
20 0.99
30 0.98
40 0.98
50 0.98
60 0.97
70 0.97
80 0.96
Table 5
Estimates of expected genetic gain for carcass traits under different pedigree error levels
Pedigree error (%) CWT BFT EMA MS
0 3.13 0.80 0.34 0.17
5 2.79 0.77 0.33 0.16
10 2.60 0.69 0.31 0.14
20 2.39 0.58 0.28 0.13
30 1.70 0.42 0.24 0.10
40 1.56 0.36 0.18 0.08
50 1.13 0.35 0.15 0.05
60 0.71 0.17 0.10 0.05
70 0.54 0.12 0.10 0.02
80 0.28 0.07 0.08 0.00

CWT, carcass weight; BFT, back fat thickness; EMA, eye muscle area; MS9, marbling score with 9 levels.

Table 6
Estimates of variance components and heritability for carcass traits under different pedigree error levels
Pedigree error (%) CWT EMA BFT MS


σ2a σ2e σ2p h2 σ2a σ2e σ2p h2 σ2a σ2e σ2p h2 σ2a σ2e σ2p h2
0 463.06 814.05 1,277.12 0.36 30.33 41.44 71.77 0.42 5.77 6.22 11.98 0.48 1.44 1.04 2.48 0.58
5 393.43 863.68 1,257.11 0.31 29.96 39.98 69.95 0.42 5.57 6.45 12.02 0.46 1.29 1.17 2.47 0.52
10 358.03 897.50 1,255.53 0.28 24.69 45.02 69.71 0.35 5.11 6.88 11.98 0.43 1.09 1.37 2.46 0.44
20 330.96 923.02 1,253.98 0.26 19.43 50.09 69.53 0.27 4.69 7.29 11.98 0.39 1.02 1.44 2.47 0.41
30 227.72 1,020.73 1,248.45 0.18 13.07 55.98 69.05 0.18 3.89 8.08 11.98 0.32 0.71 1.74 2.45 0.29
40 201.76 1,047.09 1,248.85 0.16 10.35 58.58 68.93 0.15 3.09 8.80 11.89 0.25 0.61 1.83 2.44 0.25
50 150.56 1,094.74 1,245.29 0.12 12.43 56.74 69.18 0.17 2.32 9.52 11.84 0.19 0.32 2.10 2.42 0.13
60 74.47 1,167.48 1,241.95 0.05 4.59 63.95 68.54 0.06 1.39 10.41 11.81 0.12 0.33 2.09 2.42 0.13
70 86.44 1,155.89 1,242.33 0.06 4.69 63.83 68.52 0.06 1.75 10.08 11.83 0.15 0.07 2.33 2.41 0.03
80 42.60 1,198.27 1,240.87 0.03 3.75 64.76 68.51 0.05 1.29 10.50 11.79 0.11 0.00 2.41 2.41 0.00

σ2a, additive variance; σ2e, residual variance; σ2p, phenotypic variance; h2, heritability.

REFERENCES

1. Annual report, directory and career opportunities 2019–2020 [Internet]. San Marcos, TX, USA: National Pedigreed Livestock Council; 2019. [2019 Nov 11]. Available from: http://www.nplc.net

2. Carmen LB. Pedigree analysis. In : Tufts’ Canine and Feline Breeding and Genetics Conference, 2007; Sturbridge, MA, USA.

3. Meuwissen THE. Maximizing the response of selection with a predefined rate of inbreeding. J Anim Sci 1997; 75:934–40. https://doi.org/10.2527/1997.754934x
crossref pmid
4. Steyn JW, Neser FWC, Hunlun C, Lubout PC. Preliminary report: Pedigree analysis of the Brangus cattle in South Africa. S Afr J Anim Sci 2012; 42:511–4. https://doi.org/10.4314/sajas.v42i5.14
crossref
5. Lee SH, Park BH, Sharma A, et al. Hanwoo cattle: origin, domestication, breeding strategies and genomic selection. J Anim Sci Technol 2014; 56:2 https://doi.org/10.1186/2055-0391-56-2
crossref pmid pmc
6. Lee SH, Choi BH, Cho SH, et al. Genome-wide association study identifies three loci for intramuscular fat in Hanwoo (Korean cattle). Livest Sci 2014; 165:27–32. https://doi.org/10.1016/j.livsci.2014.04.006
crossref
7. Lee SH, Choi BH, et al. Genome-wide association study identifies major loci for carcass weight on BTA14 in Hanwoo (Korean cattle). PLoS ONE 2013; 8:e74677 https://doi.org/10.1371/journal.pone.0074677
crossref pmid pmc
8. Long TE, Johnson RK, Keele JW. Effects of errors in pedigree on three methods of estimating breeding value for litter size, backfat and average daily gain in swine. J Anim Sci 1990; 68:4069–78. https://doi.org/10.2527/1990.68124069x
crossref pmid pdf
9. Harder B, Bennewitz J, Reinsch N, Mayer M, Kalm E. Effect of missing sire information on genetic evaluation. Arch Anim Breed 2005; 48:219–32. https://doi.org/10.5194/aab-48-219-2005
crossref pdf
10. Israel C, Weller JI. Effect of misidentification on genetic gain and estimation of breeding value in dairy cattle populations. J Dairy Sci 2000; 83:181–7. https://doi.org/10.3168/jds.S0022-0302(00)74869-7
crossref pmid
11. Christensen LG, Madsen P, Petersen J. The influence of incorrect sire identification on the estimates of genetic parameters and breeding values. In : Proceedings of the World Congress on Genetics Applied to Livestock Production; 1982; Madrid, Spain. p. 200–8.

12. Gelderman H, Pieper U, Weber WE. Effect of misidentification on the estimation of breeding value and heritability in cattle. J Anim Sci 1986; 63:1759–68. https://doi.org/10.2527/jas1986.6361759x
crossref pmid pdf
13. Ron M, Blanc Y, Band M, Ezra E, Weller JI. Misidentification rate in the Israeli dairy cattle population and its implications for genetic improvement. J Dairy Sci 1996; 79:676–81. https://doi.org/10.3168/jds.S0022-0302(96)76413-5
crossref pmid
14. Van Vleck LD. Misidentification in estimating the paternal sib correlation. J Dairy Sci 1970; 53:1469–74. https://doi.org/10.3168/jds.S0022-0302(70)86416-5
crossref
15. Van Vleck LD. Misidentification and sire evaluation. J Dairy Sci 1970; 53:1697–702. https://doi.org/10.3168/jds.S0022-0302(70)86465-7
crossref
16. Korean Animal Improvement Association database [Internet]. Korean Animal Improvement Association; 2014. Available from: https://www.aiak.or.kr/ka_index.jsp

17. Korea Institute for Animal Product Quality Evaluation (KAPQE). The report of livestock product marketing in Korea. Anyang, Korea: KAPQE; 2012.

18. Kim HC, Lee SH, Cho YM, et al. Genomic information and its application in Hanwoo (Korean native cattle) breeding program - a mini review. Ann Anim Resour Sci 2011; 22:125–33.

19. Oliehoek PA, Bijma P. Effects of pedigree errors on the efficiency of conservation decisions. Genet Select Evol 2009; 41:9 https://doi.org/10.1186/1297-9686-41-9
crossref pdf
20. Sargolzaei M, Schenkel FS. QMSim: A large-scale genome simulator for livestock. Bioinformatics 2009; 25:680–1. https://doi.org/10.1093/bioinformatics/btp045
crossref pmid pdf
21. R Core Team. R: A language and environment for statistical computing. Vienna, Austria: R Foundation for Statistical Computing; 2013. URL http://www.R-project.org

22. Henderson CR. Sire evaluation and genetic trends. J Anim Sci. 1973. (Issue Symposium, 1973)10–41. https://doi.org/10.1093/ansci/1973.Symposium.10
crossref pdf
23. Park B, Choi T, Kim S, Oh SH. National genetic evaluation (system) of Hanwoo (Korean native cattle). Asian-Australas J Anim Sci 2013; 26:151–6. https://doi.org/10.5713/ajas.2012.12439
crossref pmid pmc pdf
24. Yoon HB, Kim SD, Na SH, et al. Estimation of genetic parameters for carcass traits in Hanwoo steers. J Anim Sci Technol 2002; 44:383–90. https://doi.org/10.5187/JAST.2002.44.4.383
crossref
25. Do C, Park B, Kim S, et al. Genetic parameter estimates of carcass traits under national scale breeding scheme for beef cattle. Asian-Australas J Anim Sci 2016; 29:1083–94. https://doi.org/10.5713/ajas.15.0696
crossref pmid pmc pdf
26. Oikawa T, Sanehira T, Sato K, Mizoguchi Y, Yamamoto H, Baba M. Genetic parameters for growth and carcass traits of Japanese Black (Wagyu) cattle. Anim Sci 2000; 71:59–64. https://doi.org/10.1017/S1357729800054898
crossref
27. Fabrizio A, Alberto MB, Jean-Luc G, et al. Genotype by environment interaction on growth and carcass traits in beef cattle in the tropics. Adv Anim Biosci 2010; 1:372–3. https://doi.org/10.1017/S2040470010000026
crossref
28. Bovenhuis H, Van Arendonk JAM. Estimation of milk protein gene frequencies in crossbred cattle by maximum likelihood. J Dairy Sci 1991; 74:2728–36. https://doi.org/10.3168/jds.S0022-0302(91)78452-X
crossref pmid
29. Banos G, Wiggans GR, Powell RL. Impact of paternity errors in cow identification on genetic evaluations and international comparisons. J Dairy Sci 2001; 84:2523–9. https://doi.org/10.3168/jds.S0022-0302(01)74703-0
crossref pmid
30. Van Arendonk JAM, Spelman RS, van der Waaij EH, Bijma P, Bovenhuis H. Livestock breeding schemes: challenges and opportunities. In : Proceedings of the 6th World Congress on Genetics Applied to Livestock Production; 1998; Armidale, Australia. p. 407–14.

31. Sanders K, Bennewitz J, Kalm E. Wrong and missing sire information affects genetic gain in the Angeln dairy cattle population. J Dairy Sci 2006; 89:315–21. https://doi.org/10.3168/jds.S0022-0302(06)72096-3
crossref pmid
32. Richard MB. Understanding animal breeding. 2nd edLondon, UK: Pearson New International Edition; 2013.

33. Senneke SL, MacNeil MD, Van Vleck LD. Effects of sire misidentification on estimates of genetic parameters for birth and weaning weights in Hereford cattle. J Anim Sci 2004; 82:2307–12. https://doi.org/10.2527/2004.8282307x
crossref pmid pdf
34. Parlato E, Van Vleck LD. Effect of parentage misidentification on estimates of genetic parameters for milk yield in the Mediterranean Italian buffalo population. J Dairy Sci 2012; 95:4059–64. https://doi.org/10.3168/jds.2011-4855
crossref pmid


Editorial Office
Asian-Australasian Association of Animal Production Societies(AAAP)
Room 708 Sammo Sporex, 23, Sillim-ro 59-gil, Gwanak-gu, Seoul 08776, Korea   
TEL : +82-2-888-6558    FAX : +82-2-888-6559   
E-mail : editor@animbiosci.org               

Copyright © 2024 by Asian-Australasian Association of Animal Production Societies.

Developed in M2PI

Close layer
prev next