


INTRODUCTION
Many studies have examined genetic trends by regression of estimated breeding values on time [1–3]. Because gain in those studies was considerably less than what is possible under ideal circumstances, comparing actual selection practices and realized genetic gains with those intended during the past two decades is important to utilize the information in the past into the new genomic era. Firstly, to this end, we compared intended and actual yearly genetic gains for milk production (milk fat and protein yields) and conformation traits (overall feet and legs score, overall teat score, and classification final score) during the last two decades in Japan. Next, since there are four paths of selection for genetic improvement, such as sires to breed bulls (SB), sires to breed cows (SC), dams to breed bulls (DB), and dams to breed cows (DC) [4], we compared previously intended and actually practiced selection differentials for milk production and conformation traits for four paths of selection during the last two decades in Japan. Although selection index in retrospect is based on the assumptions that selection has been on an index, that the index used was the optimum one, and that all characters on which selection was based are included in the data set [5], we investigated selection index in retrospect [6,7] as a practical and simple selection criterion among milk production and conformation traits during the last two decades in Japan. Based on the index in retrospect, we compared the relative emphasis of selection regarding milk production and conformation traits between intended and realized genetic gains. The purpose of this study was to compare intended and actual yearly genetic gains for milk production and conformation traits during the last two decades in Japan, to compare the retrospective selection emphasis on those traits, and to provide insight into the new genomic era.
MATERIALS AND METHODS
Previously intended and actual realized genetic gains
Predicted genetic values were those calculated by using an animal model comprising 11,627 bulls and 4,051,752 cows [8]. Because milk fat yield (MF) and milk protein yield (MP), overall feet and legs score (FL), overall teat score (TE), and classification final score (FS) are major traits used as selection criteria in Japan [8], we considered MF and MP as traits representing milk production and FL, TE, and FS as conformation traits. The FS was derived as a total score from (frame×25)+ (feet and legs×20)+(dairy strength×15)+(udder×40), where frame, feet and legs, dairy strength, and udder ranged from 0.5 to 1.0. The selection index was composed of these five traits. Data were extracted for animals with differences in estimated breeding value (EBV) between the selected and cows born in the same year along four paths of selection (SB, SC, DB, and DC) and generation intervals, thus resulting in data for 1993 through 2012. Average EBVs of cows born in the same year as sires used or dams used were adopted as base group averages in calculating differences in predicted genetic values because they were an unselected group of animals [9]. Realized yearly genetic gains for milk production and conformation traits were calculated as the regression of average predicted genetic values in the unselected population of cows on time from 1993 through 2012.
Genetic superiority for each trait in each selection path was estimated by averaging the EBVs of sires used or dams used in each birth year of offspring and by taking the differences from the average EBV of the base group born in the same year as sires used or dams used, because where
b = σ G , EBV σ EBV 2 = 1
where ΔGSB is average genetic superiority of sires to breed bulls in 1993 through 2012; LSB is average generation interval of sires to breed bulls in 1993 through 2012; and ΔGSC, ΔGDB, ΔGDC, LSC, LDB, and LDC are defined in the same way as ΔGSB and LSB except for the abbreviations of SC, DB, and DC. The time period of 1993 through 2012 was evaluated as three periods, that is, 1993 through 2003, 2004 through 2012, and 1993 through 2012. The average selection differential, previously intended and actual realized yearly genetic gains were obtained for each of these time periods.
Index in retrospect
For simplicity, selection was assumed to have been practiced on milk production traits comprising MF and MP yields and on conformation traits comprising FL, TE, and FS. The index of selection (I) is described as:
where bi is the coefficient of the index and EBVi is the estimated breeding value for the ith trait in the index. The intended genetic response in the ith trait (ΔGi), based on the index of selection, is
where βGiI is the regression of the genetic value of the ith trait on I; Īs and Īs are the mean index values of the population and the selected group, respectively; b is a column vector composed of the coefficients (bi, i = 1, …, 5) in (2); Gi is the ith column of G corresponding to the ith trait; and G is a (5×5) genetic covariance matrix for the five traits in the index. The components of genetic covariance matrix (G) are estimated from the animal model [8]. The genetic (co)variance components and genetic correlation are shown in Table 1. The difference (Īs − Īμ)is the selection differential. In contrast, the genetic gain actually realized for each trait is given after the conclusion on selection. The index in retrospect can be obtained from equation (3). That is, because
( I ¯ s - I ¯ μ ) σ i 2
where b* is a column vector of actual coefficients in the index in retrospect and Δ is a column vector composed of actually realized yearly genetic gains for the traits of MF, MP, FL, TE, and FS from 1993–2012. Additionally, since the previously intended yearly genetic gain (ΔG/year) from 1993–2012 is calculated from (1) for each trait, index in retrospect to yield these previously intended yearly genetic gains was estimated using the intended genetic gains for the traits of MF, MP,FL, TE, and FS as the components of Δ in (4). In the same way as yearly genetic gain, genetic superiority for the traits of MF, MP, FL, TE, and FS in each path of selection for SB, SC, DB, and DC were used as the components of Δ in (4) to estimate the selection index actually applied for each path of selection. Because the coefficients in the index in retrospect (b*) are coefficients for raw data units, actual coefficients in the index in retrospect are written in standard deviation units (bs) to compare weights in index accounting for the different size of genetic variance in each trait. That is,
b i s = b i * σ G i b i , MP s
RESULTS AND DISCUSSION
Generation intervals and selection differentials
Generation intervals are shown in Table 2. Generation intervals for dams of cows did not change markedly throughout the study period and were 4.6 yr on average. The generation interval of the path of DC nearly completely agreed with the intervals in Italy [11]. The generation intervals of the paths of SB and SC decreased by approximately 10% from the 1993–2003 period to 2004–2012, and the interval of SB was shorter than that of SC owing to the avoidance of using old proven bulls as sires to breed bulls. The generation interval in the path of DB decreased by approximately 20% from 1993 through 2003 to 2004 through 2012 and was the greatest reduction among the four paths of selection. In the path of DB, National Livestock Breeding Center has produced heifers by multiple ovulation and embryo transfer and has selected them based on records in early stage of their lactations by a random-regression statistical model for estimating the genetic value of a dam’s lifetime milk production [12–15]. As a result, the proportion of DB under 30 month of age increased year by year in Japan (Figure 1) resulting in the reduction in generation interval. Average generation intervals in the four paths of selection decreased from 5.92 yr to 5.42 yr (that is, approximately 10%) from 1993–2003 to 2004–2012.
Standardized genetic superiority or differences in EBV of the selected over the cows in the base group born in the same year as the selected in the four paths of selection, i.e. selection differentials, are shown in Table 3. Selection differentials in milk production traits during 1993–2003 were greater than those of 2004–2012, whereas selection differentials in conformation traits during 1993–2003 were much smaller than those of 2004–2012. These findings indicate that selection was aimed at much greater genetic gain for milk production traits over conformation traits during 1993–2003. In contrast, selection during 2004–2012 had focused on recovering the genetically inferior situation regarding conformation traits during 1993–2003. As a result, the selection differentials had nearly the same magnitude for production and conformation traits during 2004–2012. In comparison, selection regarding milk production and conformation traits along the path of DC was minimal throughout 1993–2012. As a result, replacement rate or fraction of cows from first parity of all the cows in the herd was almost the same (28% to 31%) throughout 1993–2012 in Japan [16].
Regarding average selection differentials throughout the entire study period (1993–2012), differentials in milk production traits were generally greater than those of conformation traits in all four paths of selection; consequently, selection appears to have been aimed to attain greater genetic gain in milk production than in conformation traits during the past two decades in Japan.
Selection emphasis on milk production and conformation traits in four paths of selection
Coefficients of the index in retrospect relative to those of milk protein yield (
b i , MP s
In contrast, the SB and DB paths included a variety of coefficients for milk production and conformation traits, such that selection was intended to yield balanced genetic gains in milk production and conformation traits corresponding to the genetic requirement of each time period. For example, during 1993–2003, when selection emphasized milk production traits, the relative ratio of conformation to milk production traits was 0.08 for the selection path of SB. However, during 2004–2012, when both conformation and milk production traits were emphasized during selection, the relative ratio of conformation to milk production traits was 0.34 for the selection path of SB. For the overall study period of 1993–2012, the relative ratios were the balanced values of 0.39 and 0.51 for the paths of SB and DB, respectively. Additionally, relative emphasis of conformation to milk production traits was slightly greater for the selection path of DB than that of SB throughout the three periods of time. These results indicate that the selection of SB and of DB both focused on balanced selection between milk production and conformation traits during the last two decades in Japan. Selection of SC and of DC turned out to be exclusively based on milk production traits because there are different role allotments for genetic gain between milk production and conformation traits for SB and DB, SC and DC. Consequently each of the four paths of selection has played an individual and important role in Japan. With the development of genomic technology, generation intervals are shortening and thus, young sire arises before the completion of sire’s daughters’ milk production records. Selection of sires and dams to breed sires has played an important role in light of the balanced selection between milk production and conformation traits. Selection of SB and of DB has played an important role throughout the era of progeny testing, i.e., before the genomic era not only in Japan but other countries [9,11]. How to integrate these four paths in the genomic era to increase profitability for dairy farmers and to sustain long-term genetic gain needs to be elucidated.
Intended and realized yearly genetic gains
Yearly genetic gains actually realized and previously intended for milk production and conformation traits in 1993–2003, 2004–2012, and 1993–2012 are shown in Figure 2. Realized and intended yearly genetic gains for milk production traits followed almost the same pattern along with the three time periods of time (1993–2003, 2004–2012, 1993–2012), although realized yearly genetic gain was lower than that intended. Realized genetic gain for conformation traits had almost the same pattern as for intended genetic gain along with the three periods of time as well as milk production traits. On the other hand, overall, for 1993 through 2012, realized annual genetic gain for conformation traits was equivalent to, or greater than, that intended. These findings indicate that realized annual genetic gain in milk production traits was less than intended, whereas realized annual genetic gain for conformation traits was almost the same as, or greater than, the intended gain during the last two decades in Japan. An unfavorable small genetic correlation between milk production and fertility traits was observed [18], and peak milk yield exerted a small and unfavorable genetic effect on fertility traits [19]. Therefore, effects on fertility might lower the realized genetic gain for milk production.
Selection emphasis on milk production and conformation traits for intended and realized yearly genetic gains
Coefficients of the index in retrospect for previously intended and realized yearly genetic gains for milk production and conformation traits compared with those of MP (
b i , MP s
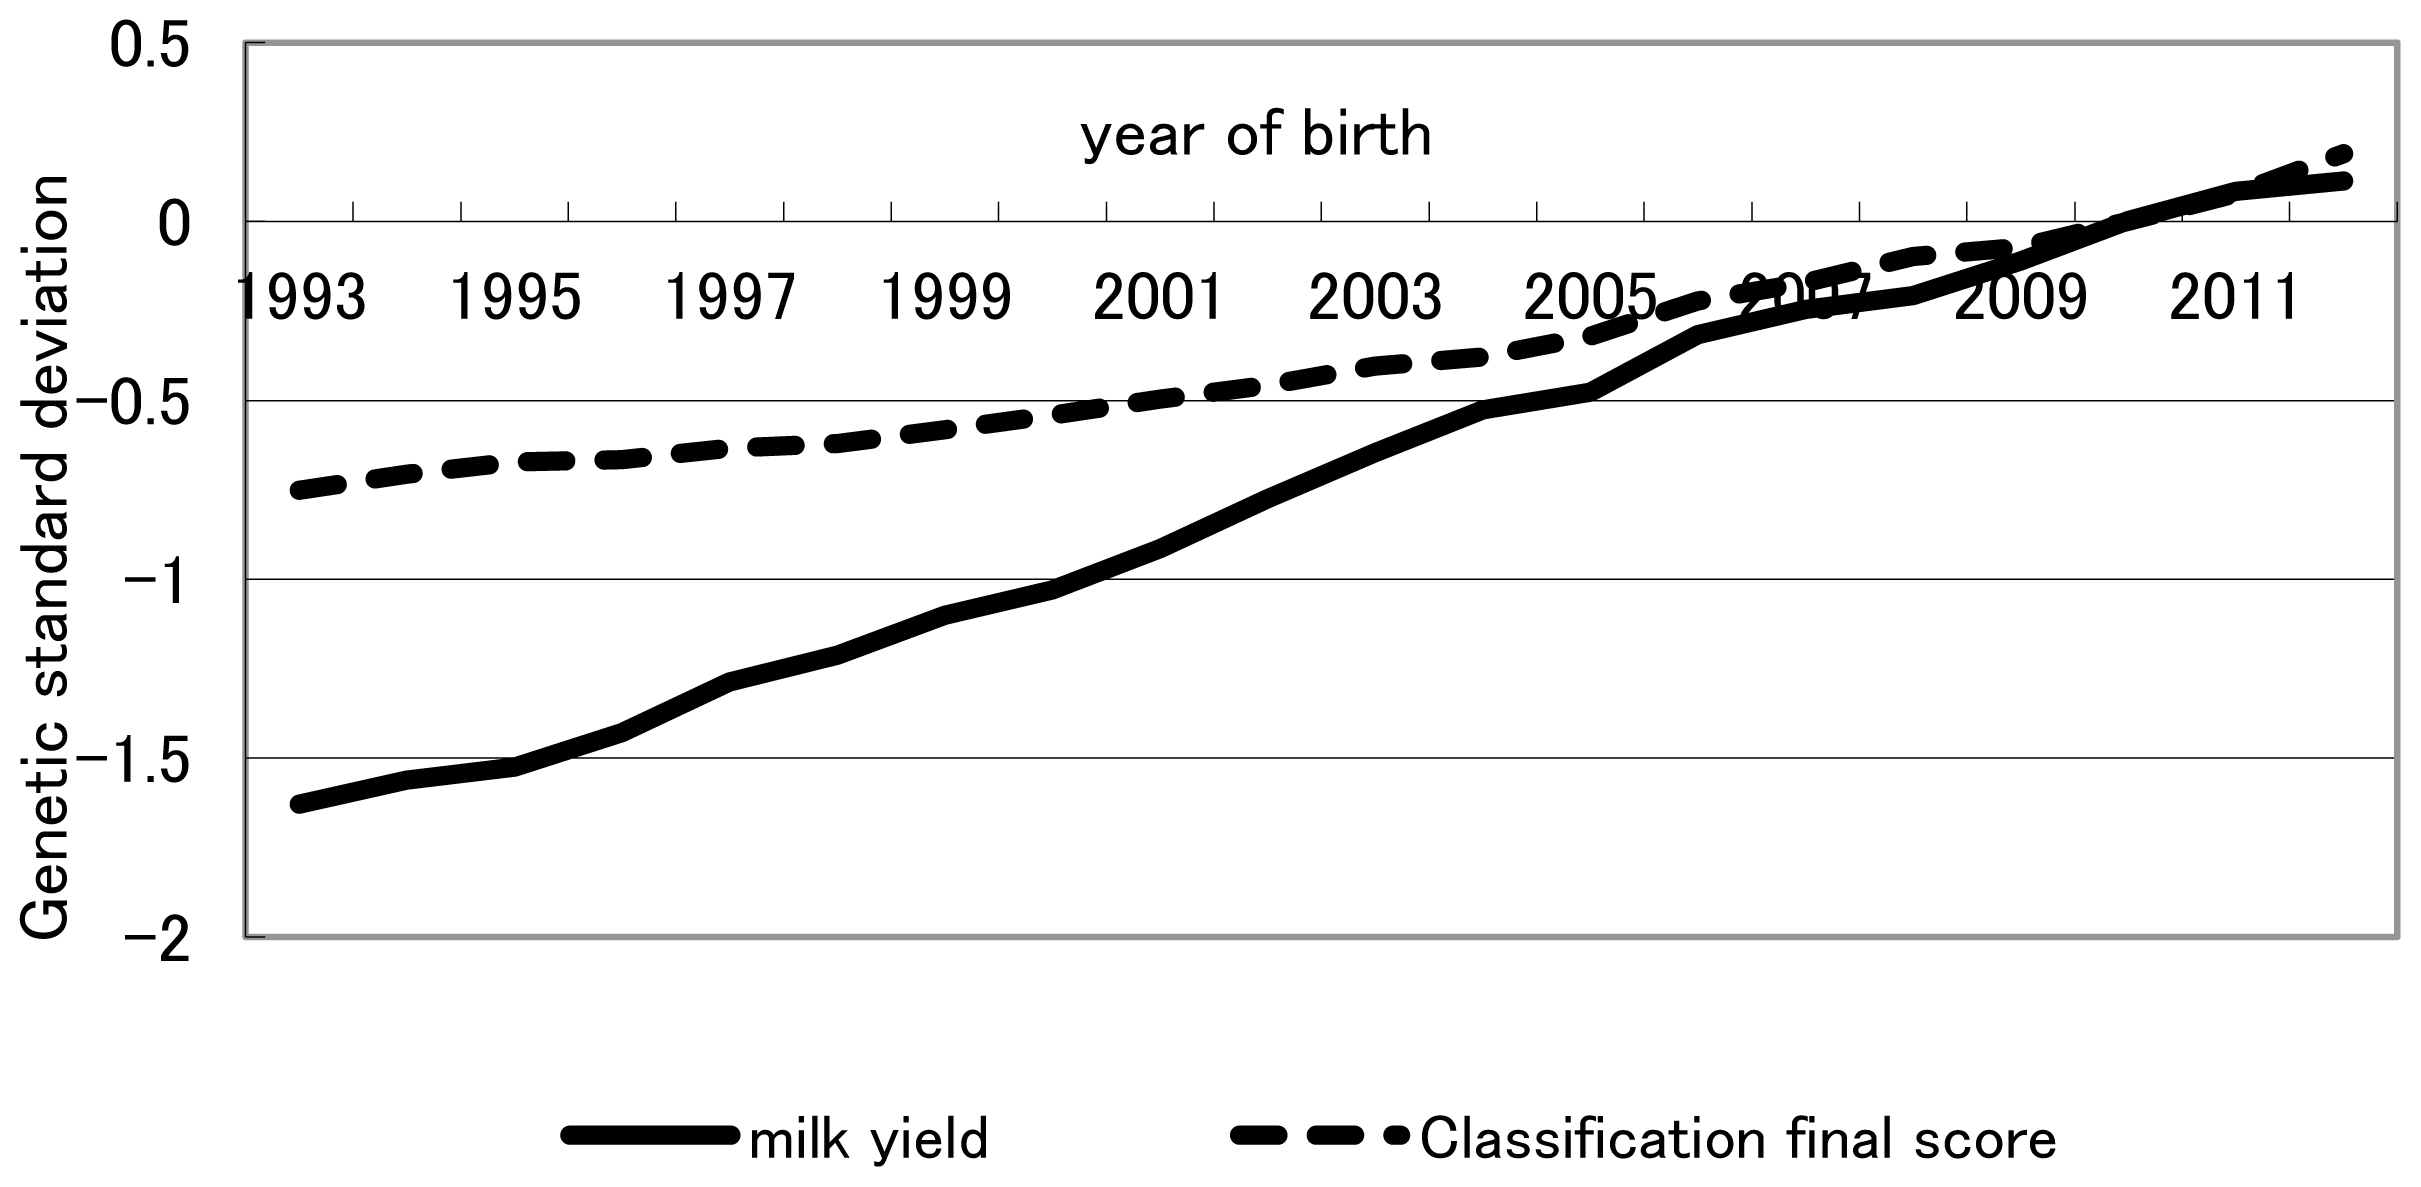
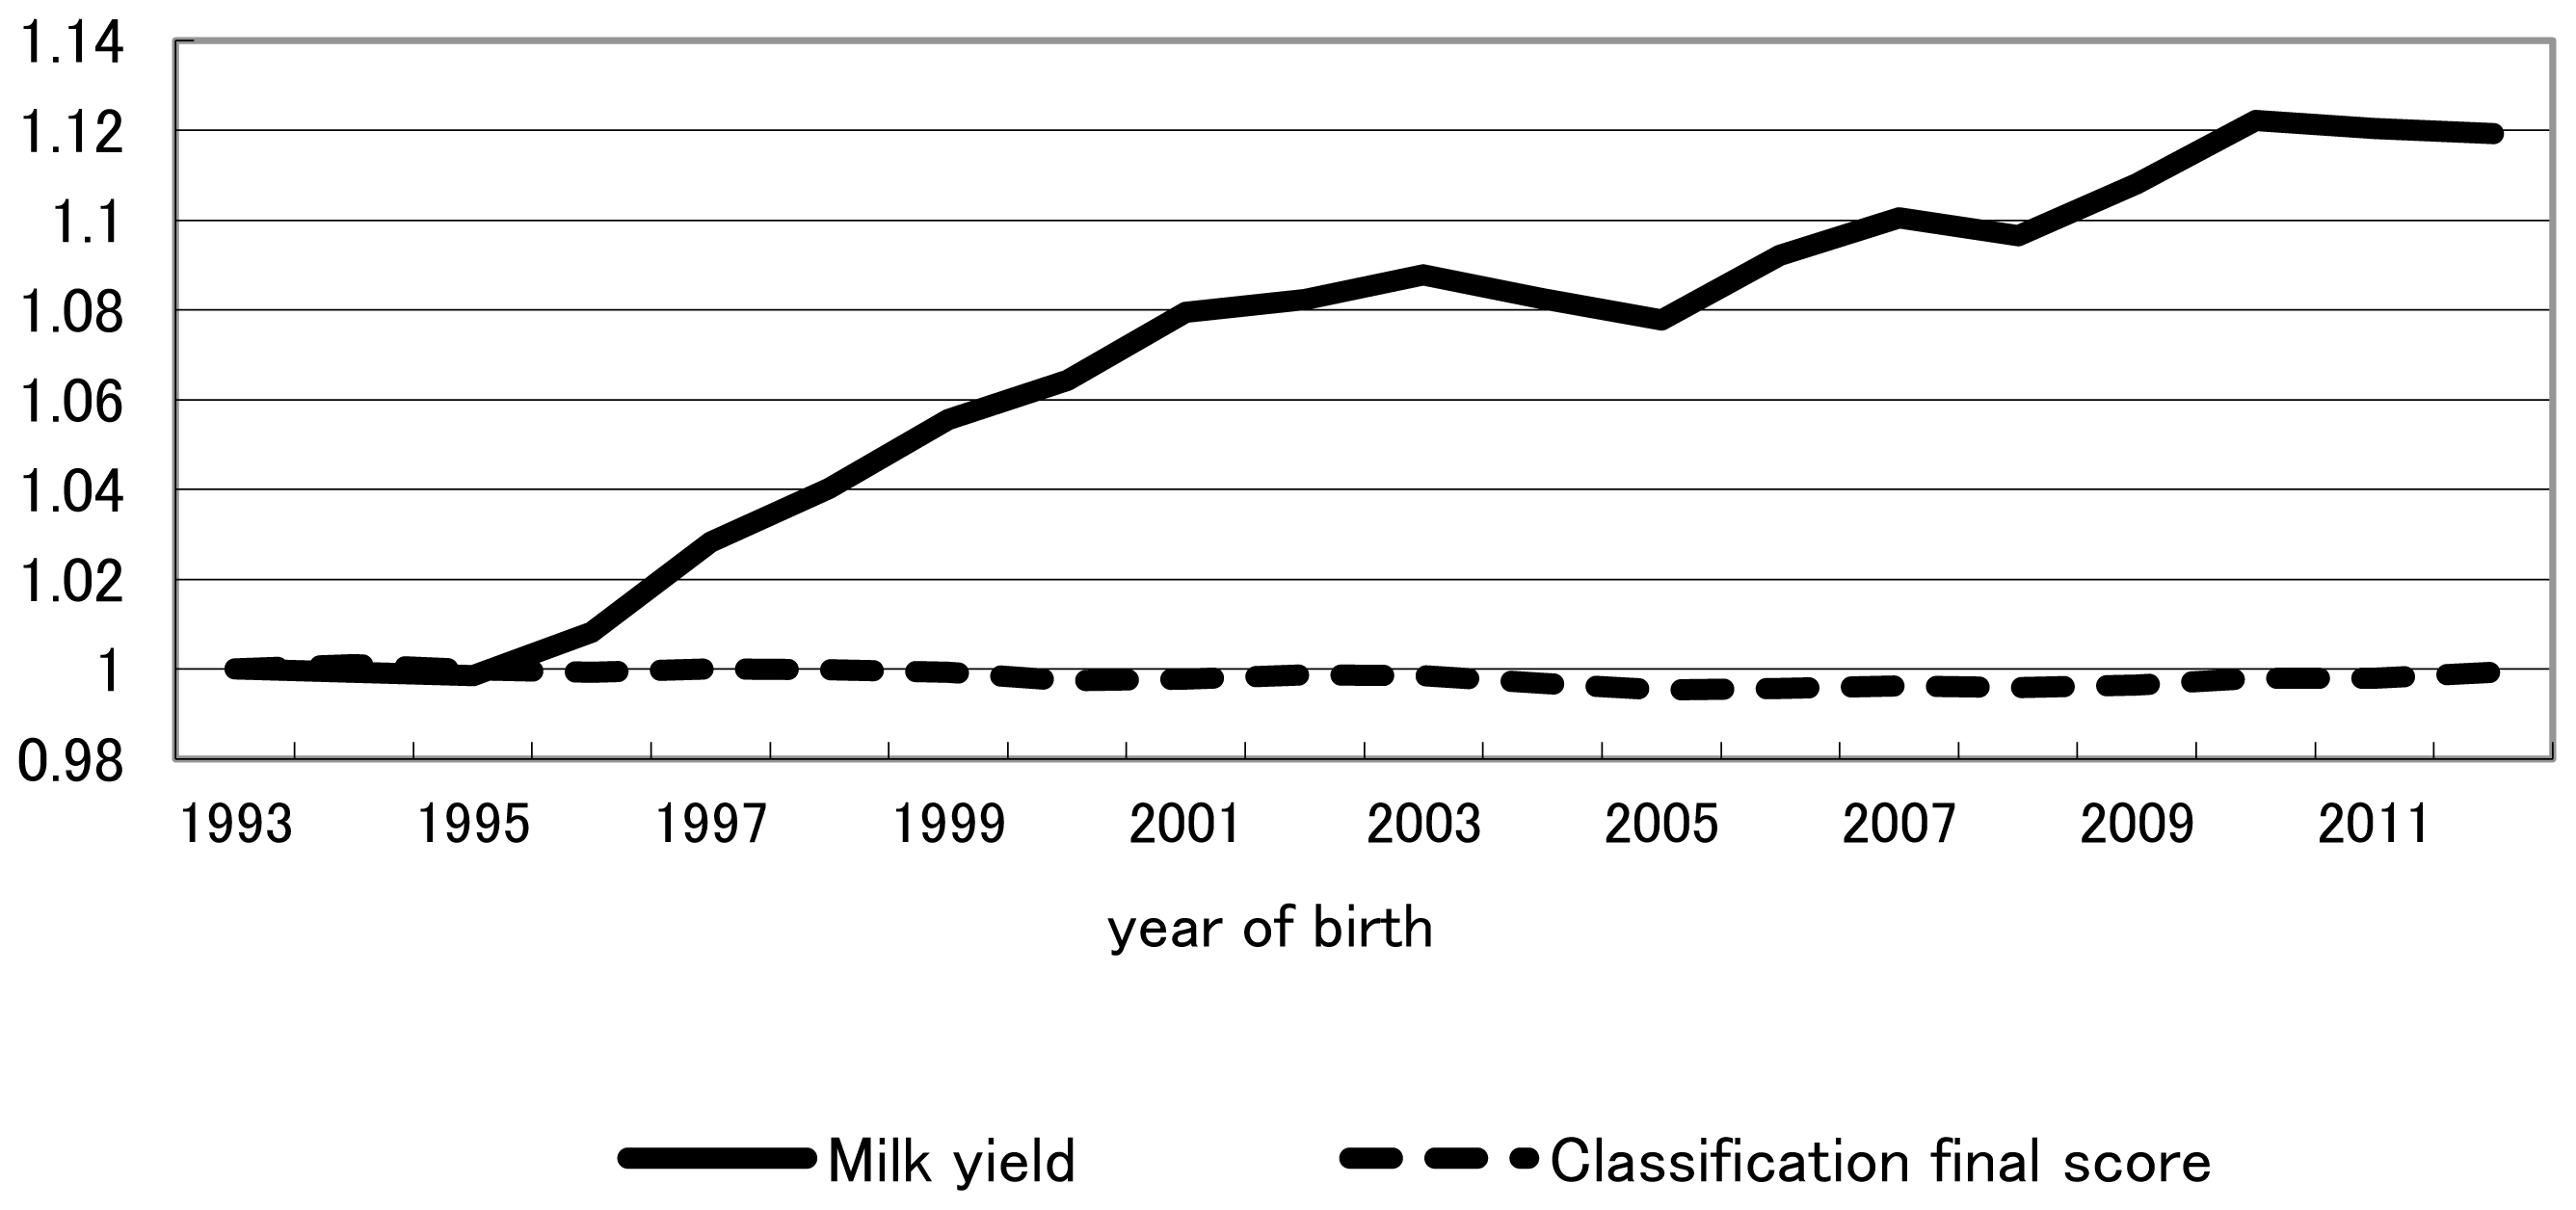
Finally, throughout the study period as a whole (1993–2012), relative weights of milk production and conformation traits based on indices in retrospect were 0.73:0.27 and 0.56:0.44 for previously intended and actually realized genetic gains, respectively. Overall, throughout the entire study period, realized yearly genetic gain was less than that intended for milk production traits, whereas realized yearly genetic gain was equal to, or greater than, that intended for conformation traits (Figure 1). The trend shown in Table 5 that the increase from 0.27 for the relative weight of conformation traits in the retrospective index in intended genetic gain to 0.44 in actually realized genetic gain likely reflects the trend recognized in Figure 1 for the overall period of 1993–2012. The fact that conformation traits had been more emphasized in actual selection than in intended selection for the past two decades, despite increased recommendation on milk production traits in NTP, indicates that breeder and dairy farmers had a tendency to balance actual selection between milk production and conformation traits. Genetic and phenotypic trends of milk yield and classification final score were plotted in Figures 3, 4, respectively. Genetic trend of milk yield was steeper than that of classification final score (Figure 3). However, regression coefficients of genetic trend of FS on year of birth from 1993 through 2003 and from 2004 through 2012 were 0.0323 and 0.0669, respectively. Regression coefficients of phenotypic trend of milk yield on year of birth from 1993 through 2003 and from 2004 through 2012 were 0.0105 and 0.0057, respectively. Yearly phenotypic increase in milk yield decreased from a period (1993–2003) to a period (2004–2012). On the other hand, phenotypic trend of FS was stable and did not decrease from a period (1993–2003) to a period (2004–2012). This indicates that dairy farmers and breeders put more weight on milk yield than FS on actual selection from 1993 through 2003. On the other hand, during a period from 2004 to 2012, they had a tendency to balance actual selection between milk production and conformation traits. NTP has been created as the desired gain index [20] without calculating economic weight for each trait in the index. It needs investigation whether these tendencies have increased profitability for dairy farmers. In addition, including somatic cell score, reproduction trait, herd life, and lactation persistency among the milk production and conformation traits studied this time and estimating the actually practiced indices in retrospect likely will be informative. Although all information on selection was not included in the index in retrospect studied, including all information would be greatly difficult in a practical sense and the information excluded would have an influence indirectly on selection on milk production and conformation traits. Consequently, relative selection emphasis between milk production and conformation traits obtained retrospectively would be worthwhile as a practical and simple weight.
CONCLUSION
Selection differentials in milk production traits were generally greater than those of conformation traits in all four paths of selection and throughout the entire study period (1993–2012). These findings imply that selection during the last two decades in Japan emphasized increasing genetic gain in milk production traits over conformation traits. Indices in retrospect for the genetic superiority of sires to breed bulls and cows and of dams to breed bulls and cows revealed that the selection of sires to breed cows and of dams to breed cows exclusively targeted genetic gain for milk production traits, whereas selection of sires to breed bulls and of dams to breed bulls sought balanced selection between milk production and conformation traits. Each of the four paths of selection has played an individual and important role. With shortening generation interval in the genomic era, a young sire arises before the completion of sire’s daughters’ milk production records. How to integrate these four paths of selection in the genomic era is vital. During the study period, the relative weights of milk production and conformation traits based on indices in retrospect were 0.73:0.27 and 0.56:0.44 for previously intended and actually realized yearly genetic gains, respectively. The increase in relative weight for conformation traits from 0.27 in previously intended genetic gain to 0.44 in actually realized genetic gain likely resulted from the tendency of breeder and dairy farmers to balance actual selection between milk production and conformation traits. This study revealed that balanced selection between milk production and conformation traits tends to be favored during actual selection. It merits investigation whether these tendencies have increased profitability for dairy farmers.
 PDF Links
 PubReader
 ePub Link
 Full text via DOI
 Download Citation
 Print
Print


